INDI Library v2.0.7 is Released (01 Apr 2024)
Bi-monthly release with minor bug fixes and improvements
For those with focus issues
- Magnus Larsson
-

- Offline
- Platinum Member
-

- Posts: 643
- Thank you received: 62
Replied by Magnus Larsson on topic For those with focus issues
No, to the best of my knowledge (it's day now so I can't test until later), it does not do this. The offset there makes the focuser move a fixed amount of tics after focusing - this to make it possible for using another filter for focusing, which is not parfocal with the current filter. For instance, I use Lum to focus instead of Ha, but there is an offset of 100 tics between them. So after focusing with Lum, focuser moves 100 tics and shifts to Ha.
If I did that, I'd need to use the V filter as my focus filter, and then have an offset. Which is not what I want, for several reasons (among them, wanting to use Lum for focusing with my parfocal RGB filters).
If I set the offset but did not use V as my focus filter, I'd still have the problem of finding focus the first time when shifting from V to Lum.
What I need is a way to handle the fact that there is an offset between V and Lum that makes a shift from one to the other problematic.
Magnus
Please Log in or Create an account to join the conversation.
- Peter Sütterlin
-

- Offline
- Supernova Explorer
-
- Posts: 1009
- Thank you received: 133
Replied by Peter Sütterlin on topic For those with focus issues
Not true. Yes, the scenario you describe is one of the applications, but basically the entries set up a mesh of relative focus differences. And they are automatically applied whenever a filter change happens, not only after focusing. If done properly, you can focus on any filter, then change to any other filter, and it should be (about) in focus. Definitely good enough to start an autofocus run...
So if you have 100 difference between Hα and V, focus Hα and then switch to V, it will shift the focus 100 units. If you focus V, then switch to Hα, it will change the focus by -100 units....
Please Log in or Create an account to join the conversation.
- Magnus Larsson
-
- Offline
- Platinum Member
-
- Posts: 643
- Thank you received: 62
Replied by Magnus Larsson on topic For those with focus issues
")
Thanks.
Magnus
Please Log in or Create an account to join the conversation.
- Magnus Larsson
-
- Offline
- Platinum Member
-
- Posts: 643
- Thank you received: 62
Replied by Magnus Larsson on topic For those with focus issues
I've now tested Linear substantially for two nights, for my variable star shots. And it is quite obvious that I now use a slightly smaller aperture in measuring those frames. That is, focus is perceptibly better, not just very reliable. So - Thanks, Hy! This is a clear improvement!
Trad off is of course speed. It takes more steps than Polynomial. In my case, I compensate by focusing slightly less often, seems to work nicely.
Magnus
Please Log in or Create an account to join the conversation.
Replied by Doug S on topic For those with focus issues
Please Log in or Create an account to join the conversation.
- Hy Murveit
-
 Topic Author
- Offline
- Administrator
-

- Posts: 1221
- Thank you received: 565
Replied by Hy Murveit on topic For those with focus issues
Here's what I did. I run:
jupyter notebook
(Since your on top of this, I assume you can install what you need to run jupyter--or I can re-look it up if you need)
I have the following in a first code cell
from pylab import *
import matplotlib
import matplotlib.pyplot as plt
import numpy as np

def fplot(points, title):
    x = [z[0] for z in points]
    y = [z[1] for z in points]

    fig = plt.figure()
    axes = fig.add_axes([0.1, 0.1, 0.8, 0.8]) # left, bottom, width, height (range 0 to 1)
    axes.plot(x, y, 'r', marker='o')
    axes.set_xlabel('position')
    axes.set_ylabel('HFR')
    axes.set_title(title);
and then in subsequent code cells, where I want to plot the focus, I run this:
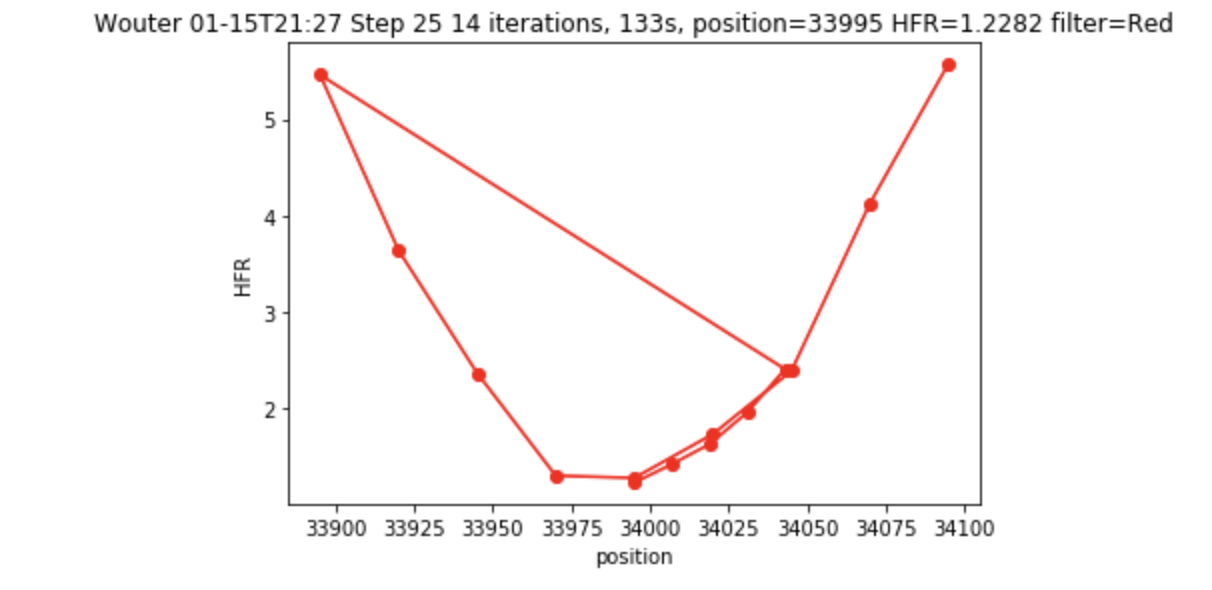
points=[(34095, 5.57398), (34070, 4.12424), (34045, 2.38664), (34020, 1.73163), (33995, 1.27697), (33970, 1.30088), (33945, 2.36508), (33920, 3.63688), (33895, 5.4582), (34043, 2.40566), (34031, 1.958), (34019, 1.62847), (34007, 1.42028), (33995, 1.2282)];iterations=14;duration=133;solution=33995;HFR=1.2282;filter='Red'
ftitle='Wouter 01-15T21:27 Step 25 ' +str(iterations)+' iterations, '+str(duration)+'s, '+'position='+str(solution)+' HFR='+str(HFR)+' filter='+str(filter)
fplot(points, ftitle)
where, of course, the points= line is just cut and pasted from the log. That gives me a plot that looks like the attached.
Hope that's helpful.
I'll send Jasem a PR to move the focus summary line to be INFO instead of DEBUG.
Hy
Please Log in or Create an account to join the conversation.
- Hy Murveit
-
Topic Author
- Offline
- Administrator
-
- Posts: 1221
- Thank you received: 565
Replied by Hy Murveit on topic For those with focus issues
He'll review and see if it gets integrated.
Hy
Please Log in or Create an account to join the conversation.
Replied by Doug S on topic For those with focus issues
Please Log in or Create an account to join the conversation.
Replied by Euripides on topic For those with focus issues
Attachments:
Please Log in or Create an account to join the conversation.
Replied by Giles on topic For those with focus issues
Please Log in or Create an account to join the conversation.
- Ron Clanton
-
- Offline
- Elite Member
-

- Posts: 225
- Thank you received: 16
Replied by Ron Clanton on topic For those with focus issues
Is there a way to only point at one star? That would seem to eliminate this issue. Or am I not understanding the process correctly?
Thanks,
Ron
Please Log in or Create an account to join the conversation.
Replied by Giles on topic For those with focus issues
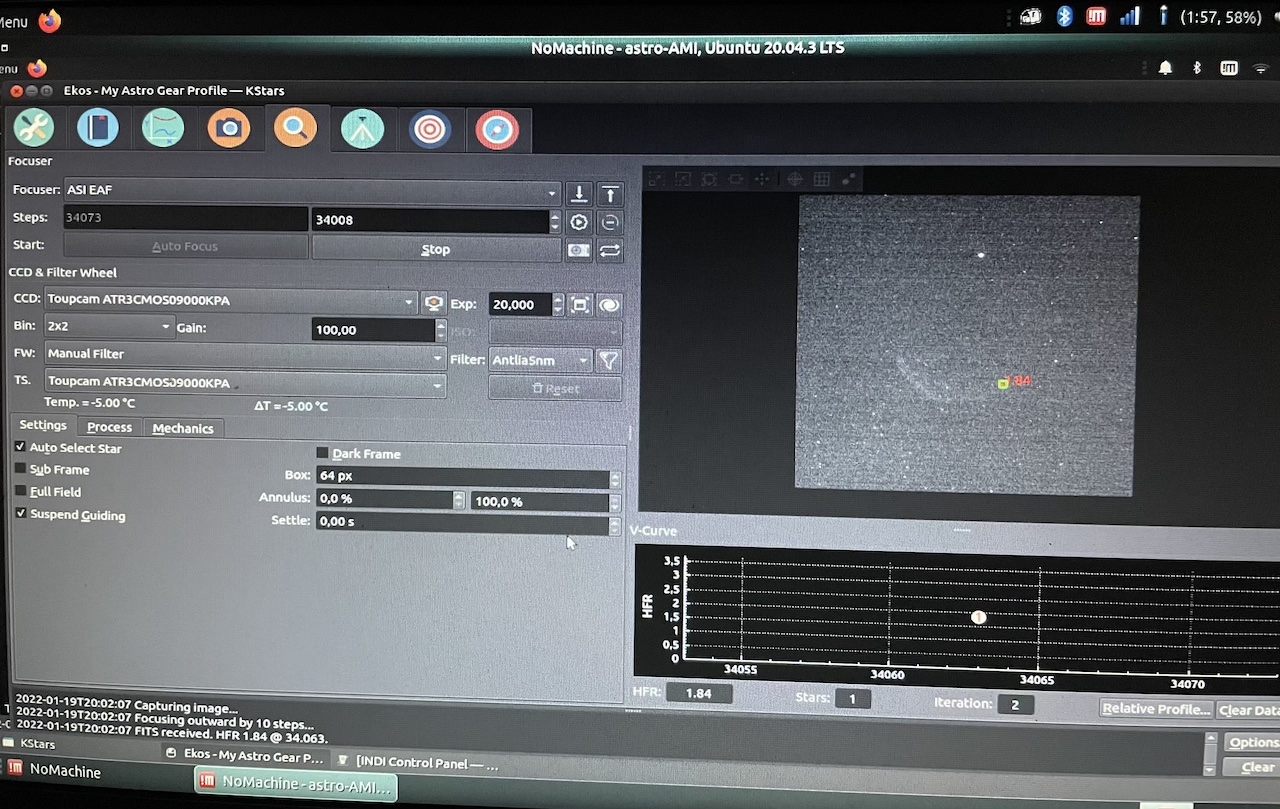
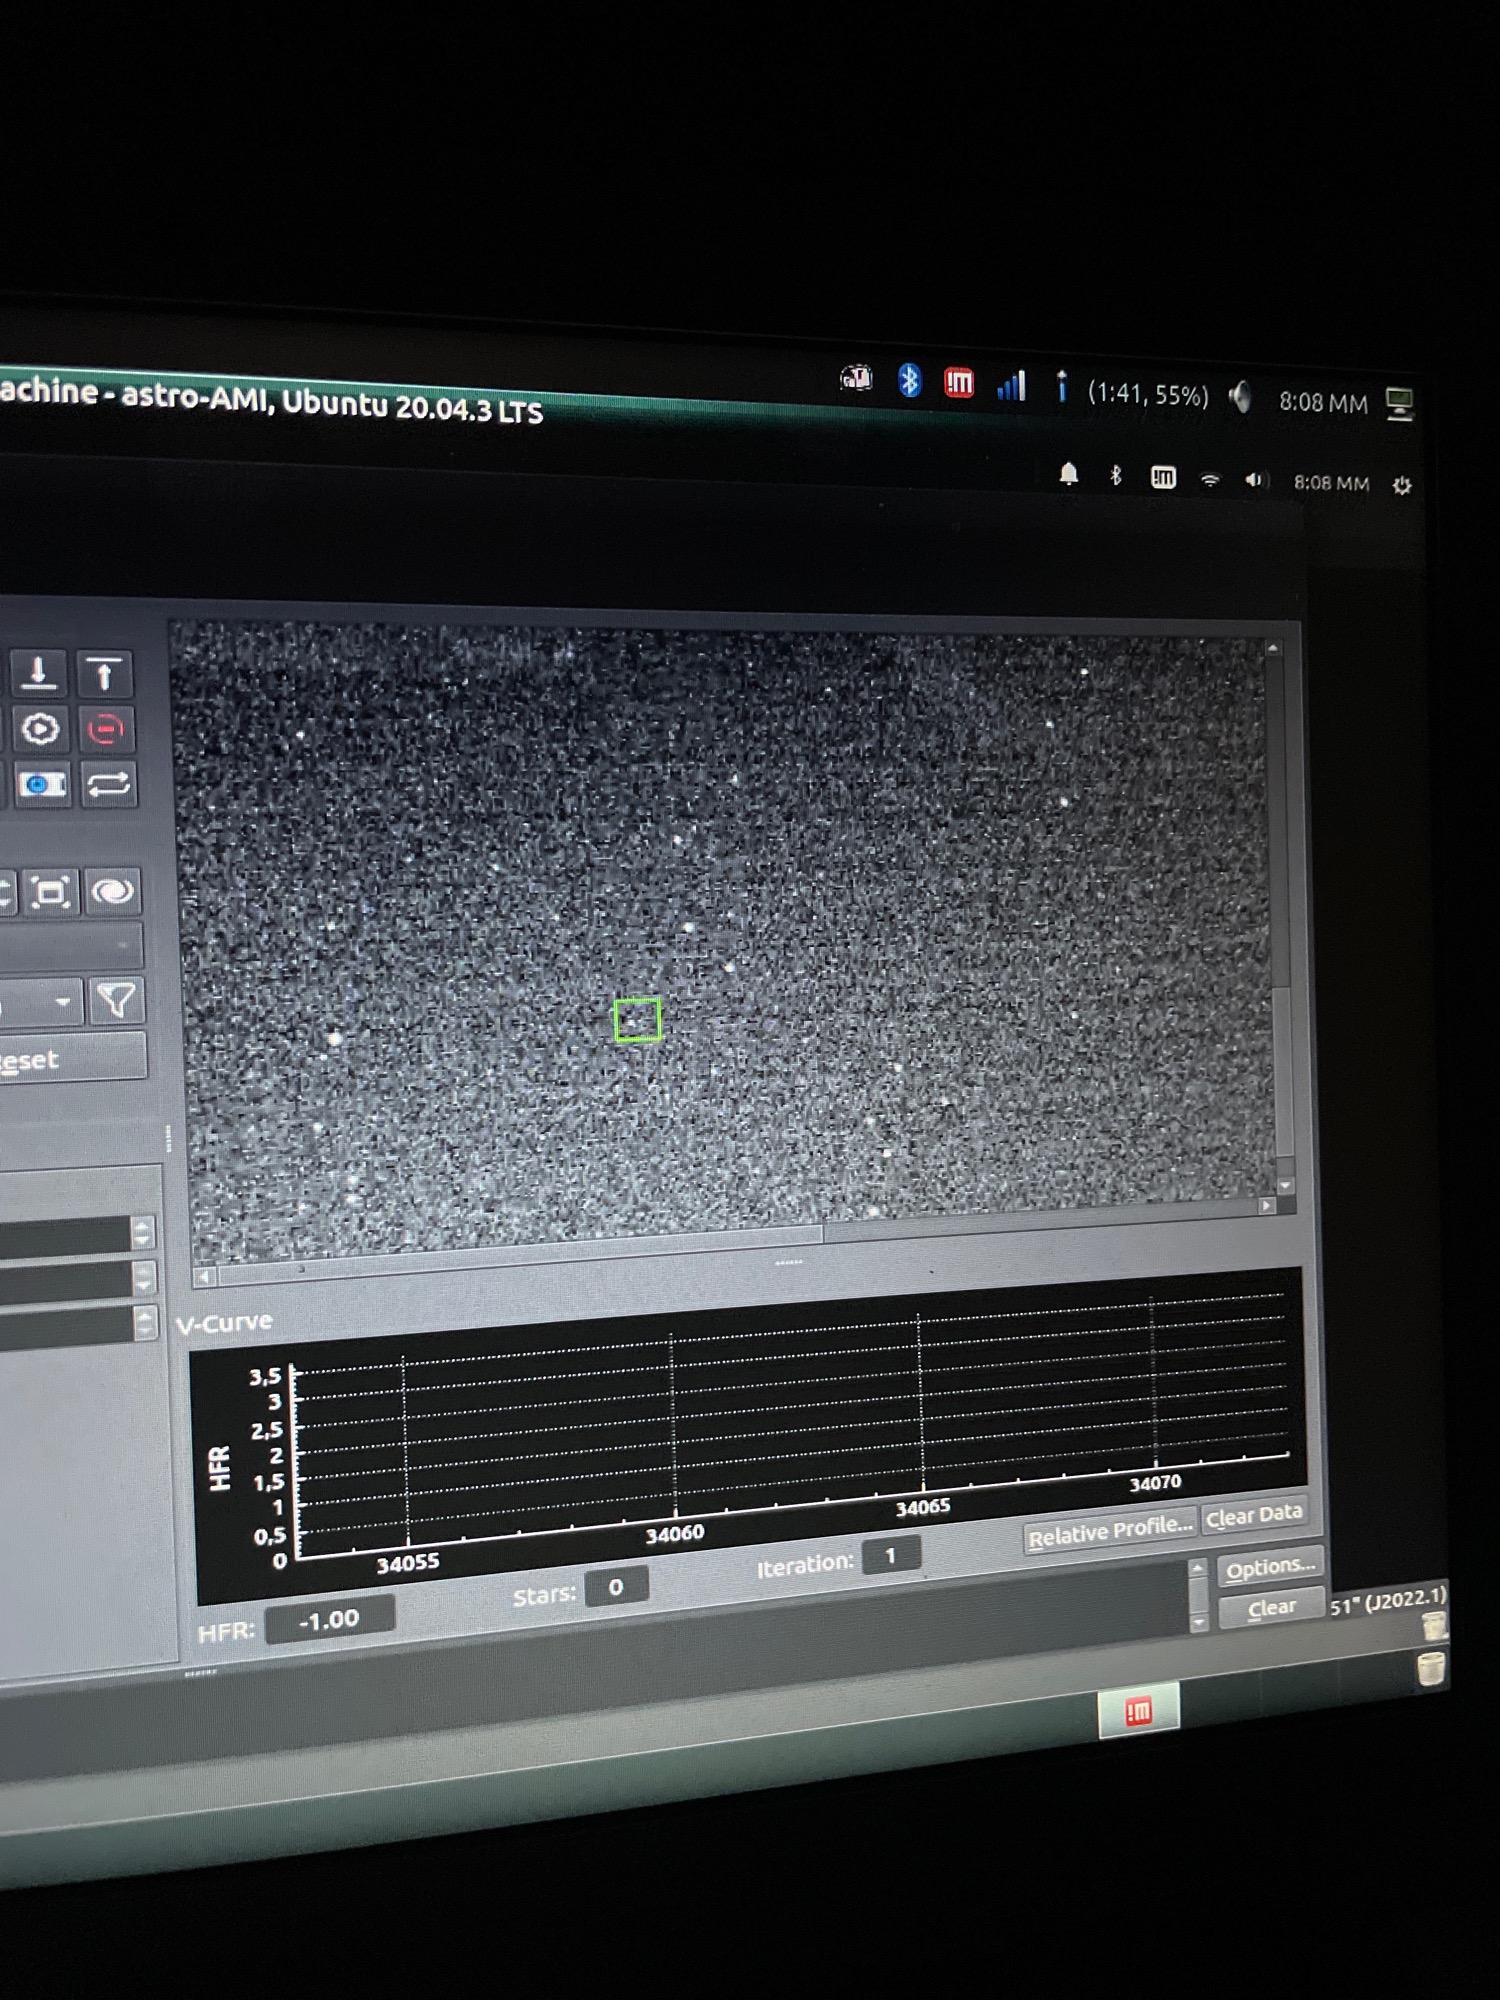
If your field is not changing all that much then you'll still get a reasonable curve, as long as enough stars are detected, changing the annulus setting allows you to select the stars in the centre of your field, or in a ring between 25% - 75% of your field of view. What you chose for these settings will depend on your target and target type.
You might want to test focus on a non-nebulous target first to get the hang of it, then move onto nebulous targets which might interfere with the algorithms.
Please Log in or Create an account to join the conversation.