INDI Library v2.0.7 is Released (01 Apr 2024)
Bi-monthly release with minor bug fixes and improvements
New KStars/Ekos Module: Analyze
- Hy Murveit
-
 Topic Author
- Away
- Administrator
-

- Posts: 1222
- Thank you received: 565
New KStars/Ekos Module: Analyze was created by Hy Murveit
Analyze is now available in the latest KStars source, will be available in nightly builds in the next day or two, and will be part of the next KStars release.
This is "V1.0". I'm sure there are improvements to be made, new features, and perhaps bug fixes. I'm hoping some of you will experiment with this, let me know how its going, and feedback ideas for improvements on this thread.
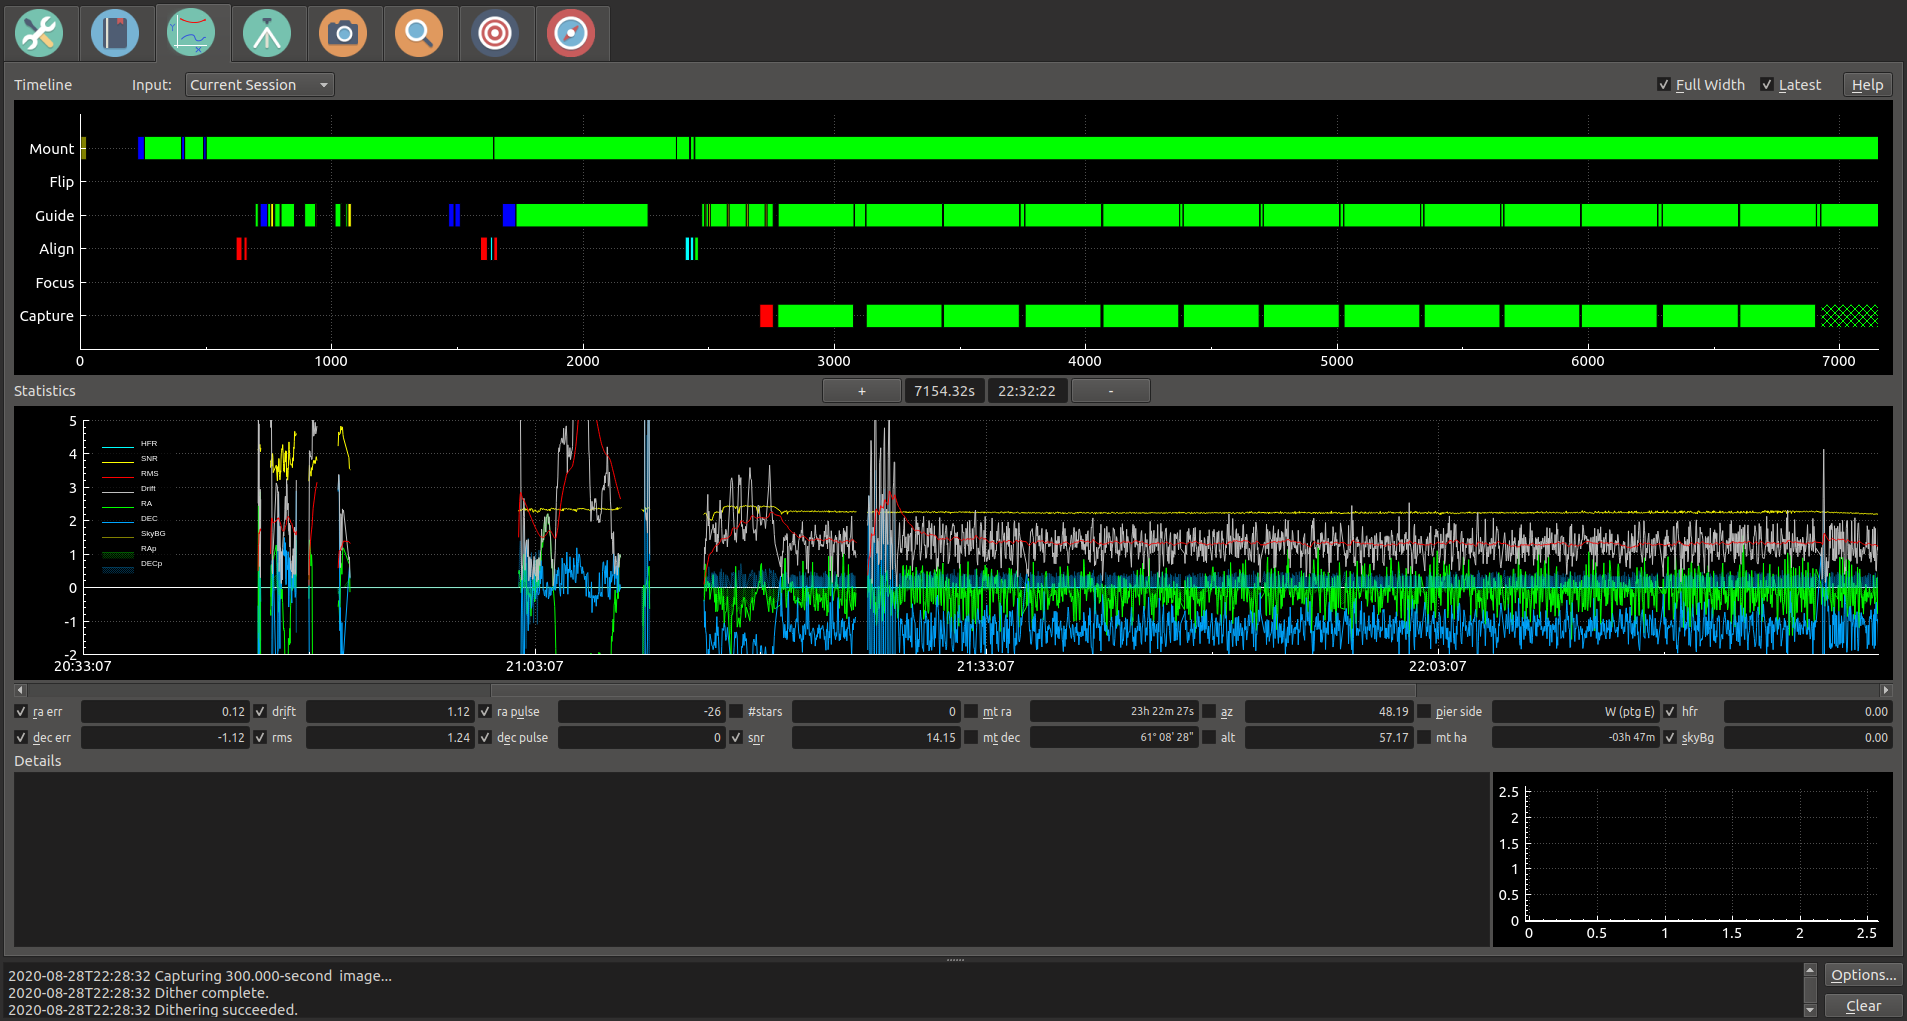
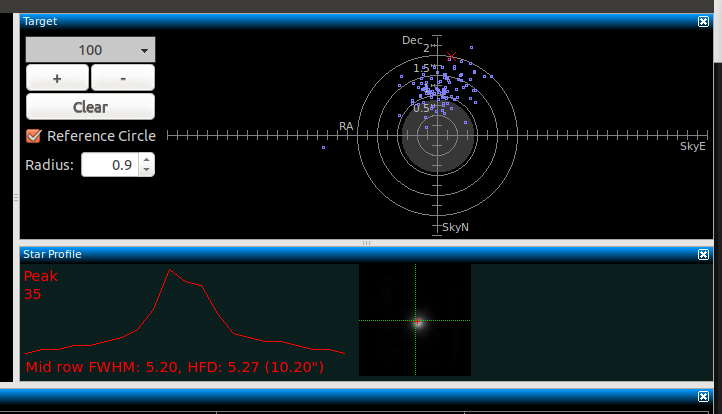
Here's a screenshot.
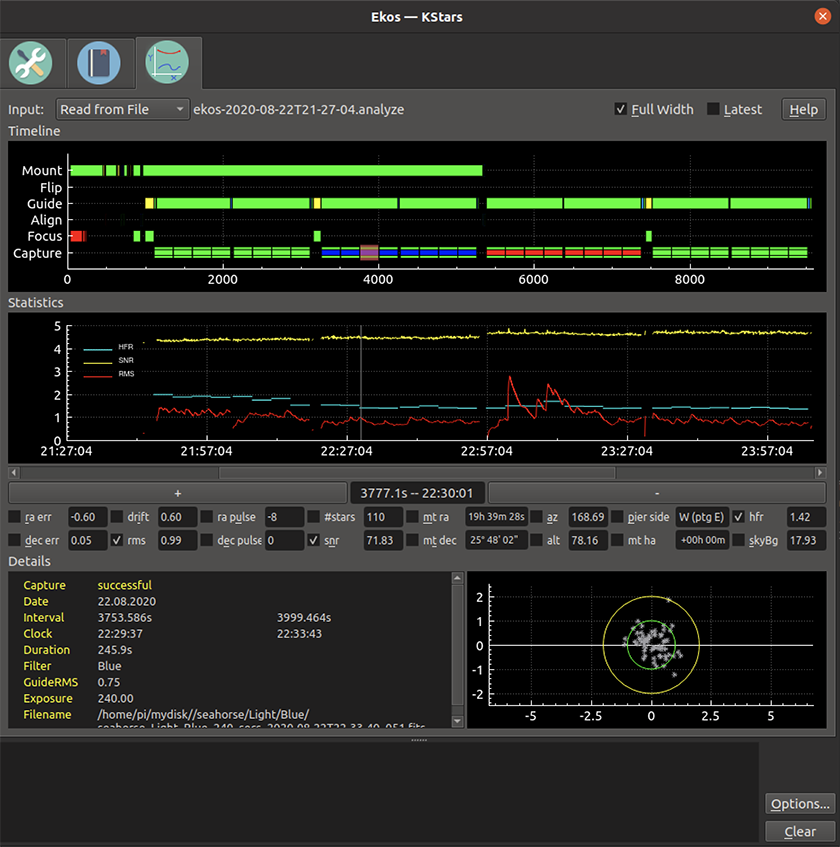
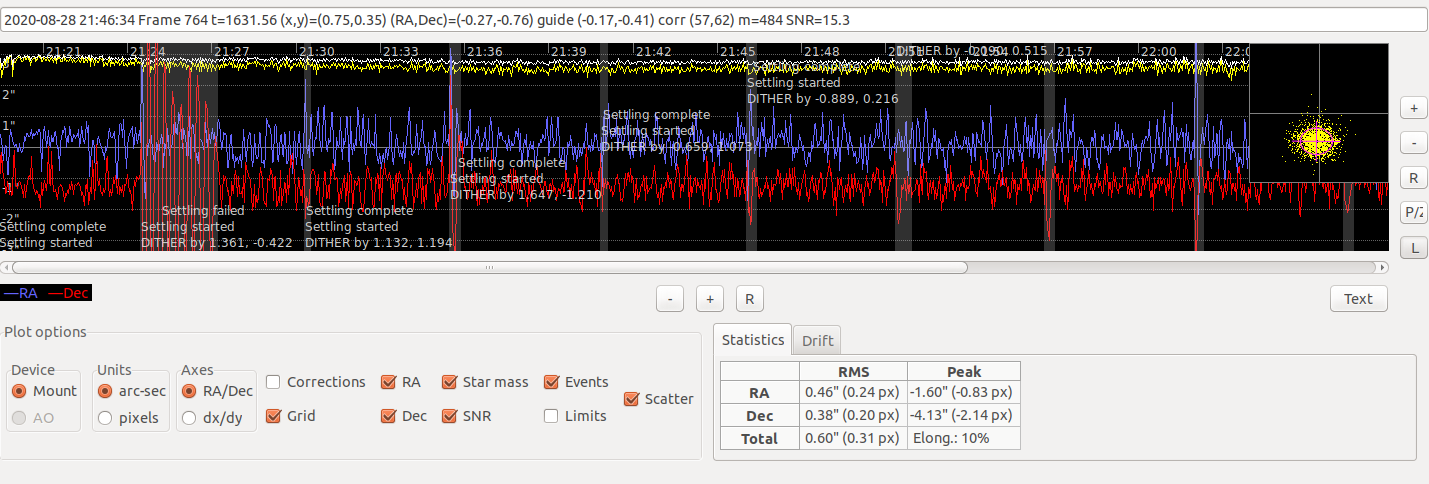
Analyze helps you understand how your imaging session is going. In the above picture, Analyze is reviewing an old imaging session from 8/22/2020 starting at 21:27:04 (see the display at the top). It shows there were 32 captures, first 8 green, then 8 blue, 8 red, and 8 green. There were several auto-focus sessions, several guiding sessions (interrupted by dithering or focus), You can see the guide drift-plot from the 3rd blue capture in the lower right, which was generated by clicking on that blue capture. The Statistics plot is showing a graph of SNR (yellow), RMS Guide Error (red), and Captured Image HFR (blue) for the imaging session which started around 21:27 and lasted until about midnight, or alternatively, about 9600 seconds long. The Details window in the bottom left is showing more information about that 3rd Blue capture.
The Help button doesn't seem to lead to a link that works properly at this point (hopefully that'll be fixed soon) but the information there is pretty much what I've included in this forum post.
More details below.
Introduction
The Analyze Module records and displays what happens in an imaging session. That is, it does not control any of your imaging, but rather reviews what occurred. Sessions are stored in an analyze folder, a sister folder to the main logging folder. Analyze can display data from the current imaging session. Alternatively, the .analyze files written there can be loaded into the Analyze tab to review an old imaging session. In this way, Analyze is similar to the left-most "setup" tab which shows progress and status of the current session, but Analyze shows much more information about what's happened, and can review old sessions.
Analyze has two main graphs, Timeline and Stats. They are coordinated--they always display the same time interval from the Ekos session, though the x-axis of the Timeline shows seconds elapsed from the start of the log, and Stats shows clock time. The x-axis can be zoomed in and out with the +/- button, mouse wheel, as well as with standard keyboard shortcuts (e.g. zoom-in == control +) The x-axis can be panned with the scroll bar as well as with the left and right arrow keys. You can view your current imaging session, or review old sessions by loading .analyze files using the Input dropdown. Checking Full Width displays all the data, and Latest displays the most recent data (you can control the width by zooming).
Timeline
Timeline shows the major Ekos processes, and when they were active. For instance, the Capture line shows when images were taken (green sections) and when imaging was aborted (red sections). Clicking on a green section gives information about that image, and double clicking on one brings up the captured image in a FitsViewer, if it's available. [Note: if you've moved your captured images, you can set alternate directory in the input menu to a directory which is the base of part of the original file path.] Clicking on a Focus segment shows focus session information and displays up the position vs HFR measurements from that session. Clicking on a Guider segment shows a drift plot from that session, (if it's guiding) and the session's RMS statistics. Other timelines show status information when clicked.
Statistics
A variety of statistics can be displayed on the Stats graph. There are too many for all to be shown in a readable way, so select among them with the checkboxes. A reasonable way to start might be to use RMS, SNR (using the internal guider with SEP Multistar), and HFR (if you have auto-compute HFR in the FITS options). Experiment with others. The axis shown (0-5) is appropriate only for ra/dec error, drift, rms, pulses, and hfr. These may be y-axis scaled (awkwardly) using the mouse wheel, but the other graphs cannot be scaled. To reset y-axis zooming, right-click on the Stats plot. Clicking on the graph fills in the values of the displayed statistics. This graph is zoomed and panned horizontally in coordination with the timeline.
Please Log in or Create an account to join the conversation.
- Scott Denning
-
- Offline
- Elite Member
-

- Posts: 300
- Thank you received: 57
Replied by Scott Denning on topic New KStars/Ekos Module: Analyze
Please Log in or Create an account to join the conversation.

Replied by Rajah on topic New KStars/Ekos Module: Analyze
Please Log in or Create an account to join the conversation.
Replied by alacant on topic New KStars/Ekos Module: Analyze
Work of art.
So good to have all this in just one window.
Cheers,
Steve
Please Log in or Create an account to join the conversation.
- Rick Bassham
-
- Offline
- Elite Member
-

- Posts: 216
- Thank you received: 120
Replied by Rick Bassham on topic New KStars/Ekos Module: Analyze
Feature request: Another checkbox to calculate and show star eccentricity in the images would be awesome. Guiding RMS approximates what I can expect from the image, but actually measuring eccentricity and seeing graphed next to the guiding info would be useful to me.
Please Log in or Create an account to join the conversation.
Replied by Alfred on topic New KStars/Ekos Module: Analyze
Please Log in or Create an account to join the conversation.
- Sonny Cavazos
-
- Offline
- Elite Member
-
- Posts: 239
- Thank you received: 38
Replied by Sonny Cavazos on topic New KStars/Ekos Module: Analyze
Please Log in or Create an account to join the conversation.
- Gonzothegreat
-

- Offline
- Moderator
-

- Posts: 2255
- Thank you received: 223
Replied by Gonzothegreat on topic New KStars/Ekos Module: Analyze
Please Log in or Create an account to join the conversation.

Replied by fmozza on topic New KStars/Ekos Module: Analyze
But very nice tool!
Regards,
jmh
Please Log in or Create an account to join the conversation.
Replied by Ken Self on topic New KStars/Ekos Module: Analyze
On the other hand, RMS values should be calculated about the mean so a constant offset becomes the mean and therefore cancels out of the RMS value.. This is how PHD2 calculates the RMS as you can see.
Please Log in or Create an account to join the conversation.
- Hy Murveit
-
Topic Author
- Away
- Administrator
-
- Posts: 1222
- Thank you received: 565
Replied by Hy Murveit on topic New KStars/Ekos Module: Analyze
Internal guider, see
invent.kde.org/education/kstars/-/blob/m...uide/gmath.cpp#L1242
SquareError(t) = ((RA(t) - RA_target(t))**2 + (DEC(t) - DEC_target(t))**2)
In the PHD2 case, the RA(t) - RA_target(t) or diff_ra_arcsecs is taken straight from PHD2 (PHD2 calculates that and sends it to Ekos).
See invent.kde.org/education/kstars/-/blob/m...lguide/phd2.cpp#L487 for PHD2 part.
So, in the PHD2 case, Ekos is taking as the RA or DEC error, what PHD2 says is the RA or DEC error.
Analyze implements an IIR filter with an approximate time constant of 40 samples (nothing magic about 40 samples == about 2 minutes with 3s samples)
// initialize
filteredRMS = 0;
constexpr double timeConstant = 40.0;
rmsFilterAlpha = 1.0 / pow(timeConstant, 0.865);
// at every time sample (x below is SquareError(t) above)
filteredRMS = rmsFilterAlpha * x + (1.0 - rmsFilterAlpha) * filteredRMS;
invent.kde.org/education/kstars/-/blob/m...yze/analyze.cpp#L485
and takes the sqrt of the (poorly named) filteredRMS to get the rms value you see. (I guess I should have named it filteredSquareError).
invent.kde.org/education/kstars/-/blob/m...yze/analyze.cpp#L542
It does not take the mean of the RA or DEC samples. I understand your logic, though, why that might be nice.
All that said, that's not quite true for the case of RMS error printed in the Details box, e.g. when you click on a guide timeline session or a capture timeline session.
There, it does not use an approximate IIR filter, but rather computes exactly the sqrt of the sum of the square error in the interval.
In any event, just to be clear, this is what is currently implemented.
Happy to entertain suggestions,
Hy
Please Log in or Create an account to join the conversation.
- Ferrante Enriques
-
- Offline
- Elite Member
-
- Posts: 249
- Thank you received: 62
Replied by Ferrante Enriques on topic New KStars/Ekos Module: Analyze
@Rick, I'm thinking to use the .analyze file as the only source of information for Astrodom. What do you think?
ferrante
Please Log in or Create an account to join the conversation.