INDI Library v2.0.7 is Released (01 Apr 2024)
Bi-monthly release with minor bug fixes and improvements
New KStars/Ekos Module: Analyze
- Hy Murveit
-
 Topic Author
- Offline
- Administrator
-

- Posts: 1221
- Thank you received: 565
Replied by Hy Murveit on topic New KStars/Ekos Module: Analyze
I considered the FFT idea, certainly could be a future. If you want to see that now, you may not know that you can take the guidelog that is saved (see the guidelogs directory that's parallel to the logs directory). That log is compatible with phdlogview, even if you were using the internal guider. So load a log into phdlogview, and use their frequency analysis tool.
Hy
Please Log in or Create an account to join the conversation.
Replied by Bart on topic New KStars/Ekos Module: Analyze
Please Log in or Create an account to join the conversation.
Replied by Greg on topic New KStars/Ekos Module: Analyze
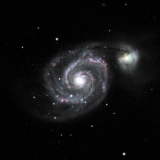
The camera in this case is an FLI ML16000.
Please Log in or Create an account to join the conversation.
- Hy Murveit
-
Topic Author
- Offline
- Administrator
-
- Posts: 1221
- Thank you received: 565
Replied by Hy Murveit on topic New KStars/Ekos Module: Analyze
Derek,
Thanks again for trying out Analyze. I agree that an SQR-type measure is something that should be in Analyze.
SQM itself is possible, but there are complications . For example, I believe the right way to do it is to subtract a dark from the signal,
get the median pixel value, multiply by the inverse of the bandwidth of the optical system, (e.g. if you're using a Blue fliter, or more extreme Ha,
fewer photons reach the sensor than if you're using an L, or a 1-shot camera) then do a little math--have it written down somewhere
")
This is complicated by the need of the dark and the need to know the filter bandwidth, but certainly possible.
I did provide "Sky Background", the checkbox furthest to the right on the 2nd line, which is the background sky value SEP (Sextractor)
computes when extracting stars, but I see yours isn't populated. I think you need to be using SEP MultiStar guiding to get that value.
I can improve requirements like this after 3.5 when SEP improvements being done by @rlancaste are scheduled for release
You might SEP MultiStar guiding and look at the sky background feature if possible.
Another straight-forward thing I could do is simple add the median pixel value, which is "pretty much the same" as the SQM, except of course
it's linear, not log, has an offset, is affected by filter bandwidth, ...
I have gone through the exercise of computing SQM from median pixel values.Obviously SQM would be more ideal, though.
Adding new features (now that I've filled up the 2 rows) would required a little UI redesign, but I don't think it's too bad. I had planned on organizing
these features into "guiding", "image" and "mount" sections, and SQM and ellipticity would fit in the image section nicely.
What do you think? Would the basic median work for you? Does sky-background look OK as is?
Hy
PS I see you're afflicted with the same "after focus guiding correction" that afflicts me.
I'll definitely look into this further someday, if someone doesn't beat me to it.
Please Log in or Create an account to join the conversation.
Replied by Derek on topic New KStars/Ekos Module: Analyze
I was thinking of SQM from a unihedron sky quality meter. If there is one is connected to INDI then collect data from it. I think its probably very difficult to estimate real SQM (in units of MPSAS) from an image.
So basically if there is an SQM device and it is connected with INDI, collect that data every x min or at every capture.
Yes, I have that after focus correction
") As a work around I include a 10second wait in all my Ekos sequences. That 10 seconds is usually enough for the guiding to get back on track. I was thinking to try and not suspend guiding during focus next time and see how it goes.
As a work around I include a 10second wait in all my Ekos sequences. That 10 seconds is usually enough for the guiding to get back on track. I was thinking to try and not suspend guiding during focus next time and see how it goes.Thanks again for this amazing feature!
Derek
Please Log in or Create an account to join the conversation.
Replied by Greg on topic New KStars/Ekos Module: Analyze
Back to the HFR values as represented in the Analyze tab (and sometimes not). I believe this is related to whether the "Use FITS Viewer" setting is active. I tend to keep it off as I don't want the popup - seeing the result on the Setup/Status tab is sufficient for me in most cases. So, when that option is off, the HFR values are 0.00, if anything at all. If the option is on, we get values.
Any chance the HFR numbers can be gleaned from whatever mechanism decides if focusing needs to happen before starting the next exposure?
Greg
Please Log in or Create an account to join the conversation.
- Ferrante Enriques
-
- Offline
- Elite Member
-

- Posts: 249
- Thank you received: 62
Replied by Ferrante Enriques on topic New KStars/Ekos Module: Analyze
I've noticed two minor issues:
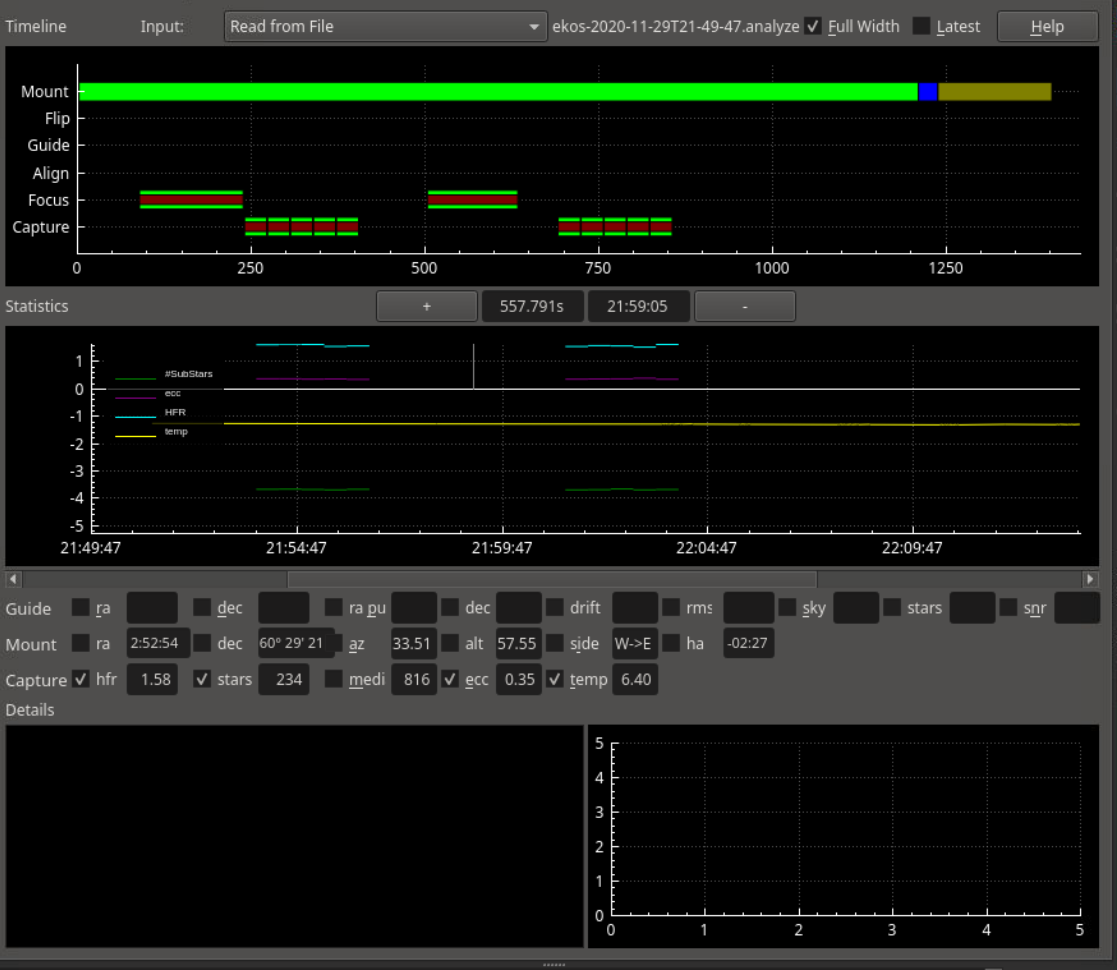
- the Temp parameter has different values in the checkbox and in the chart. For example see attached image, the temp value is recorded as 6.40 but plotted as -1 (yellow line).
- The Details windows are always empty; maybe the reason is not having guiding data but the left panel should show at least capture data from my understanding.
ferrante
Please Log in or Create an account to join the conversation.
- Hy Murveit
-
Topic Author
- Offline
- Administrator
-
- Posts: 1221
- Thank you received: 565
Replied by Hy Murveit on topic New KStars/Ekos Module: Analyze
Both of these very reasonable comments are more "UI features/bugs" than software issues.
<code>Disclaimer--I tried to document the Analyze interface in the KStars handbook and the "not too useful for Analyze at this point" Help button
points to that, but unfortunately, the online KStars Handbook has not been updated since before Analyze was pushed
due to some server issue.</code>
<strong>Temperature</strong>: There are many possible plots in Analyze, and many of them have different scales & offsets on their Y-axis.
The displayed y-axis refers to those that typically range in the single digits, like RA & DEC errors, RMS error, etc.
Temperature has its own scale, not displayed, and to get its value you look at the temperature box.
You can see the shape of the curve from the graph display, but not the actual value.
Same is true for "number of stars", "median sample value", ...
I could have come up with some complicated interface where you click on a feature whose y-axis should be added to the plot, but
I kept it simple for now and only show the one y-axis for RA/DEC/RMS/.... Happy to consider suggestions for other possible UIs.
Hopefully things will be more clear once the documentation goes online.
<strong>Details</strong>: You populate the details window and graph by clicking on a segment in the timeline. Then it displays details about that segment.
Try this for capture and focus timeline segments in particular.
BTW, thought not complete, there is some doc for Analyze on the first post in this thread.
Hy
Please Log in or Create an account to join the conversation.
- Ferrante Enriques
-
- Offline
- Elite Member
-
- Posts: 249
- Thank you received: 62
Replied by Ferrante Enriques on topic New KStars/Ekos Module: Analyze
I used Analyze on a set of images taken last night and it helped a lot to choose which were good or not before downloading from the observatory.
To me it would also be useful if images that don't match some criteria (e.g. HFR>1.5, Eccentricity>0.6) could be discarded /deleted before saving.
Ferrante
Please Log in or Create an account to join the conversation.
Replied by Jim on topic New KStars/Ekos Module: Analyze
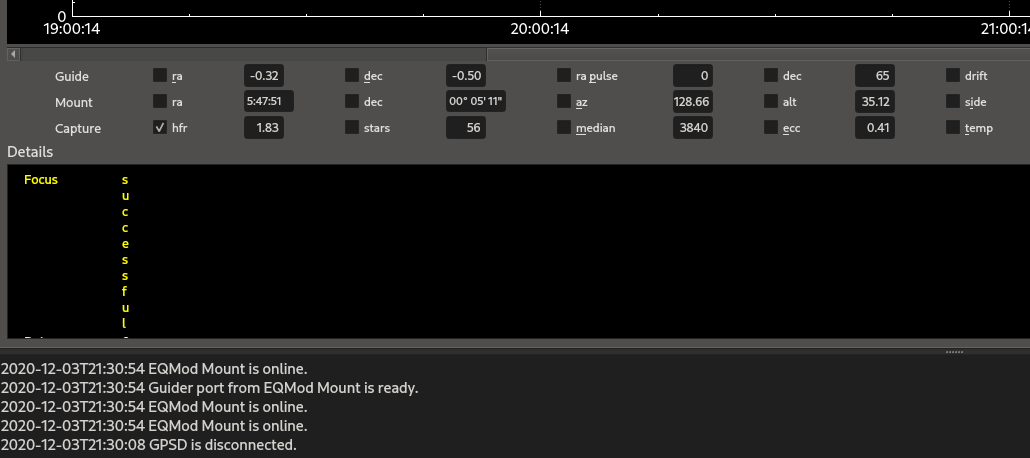
First, when I click on a "focus" segment or an captured image segment in the top section, I get these logs:
[2020-12-03T22:48:40.694 CST WARN ][                       default] - QString::arg: Argument missing: <tr><td style="color:yellow">HFR</td><td colspan="2">1.80</td></tr>,
[2020-12-03T22:48:40.695 CST WARN ][                       default] - QString::arg: Argument missing: <tr><td style="color:yellow">Iterations</td><td colspan="2">18</td></tr>,
[2020-12-03T22:48:40.695 CST WARN ][                       default] - QString::arg: Argument missing: <tr><td style="color:yellow">Filter</td><td colspan="2">Red</td></tr>,
[2020-12-03T22:48:40.695 CST WARN ][                       default] - QString::arg: Argument missing: <tr><td style="color:yellow">Temperature</td><td colspan="2">6.0</td></tr>,
Second, when I click on a focus segment in the top section, the details are vertical with 1 letter width (see attached image).
Thanks
Jim
Please Log in or Create an account to join the conversation.
- Hy Murveit
-
Topic Author
- Offline
- Administrator
-
- Posts: 1221
- Thank you received: 565
Replied by Hy Murveit on topic New KStars/Ekos Module: Analyze
Can you say what your locale is? Can you test in other locales and see if it works? (Sorry, I'm new to this and don't really
know how to test with different locales). Would be happy to try and fix it if we knew more.
Hy
Please Log in or Create an account to join the conversation.
- Scott Denning
-
- Offline
- Elite Member
-
- Posts: 300
- Thank you received: 57
Replied by Scott Denning on topic New KStars/Ekos Module: Analyze
Would you consider turning off the guide panel if there's no guider set up, and then expanding gate vertical scale of the top two panels to fill the window?
I'm imaging unguided and my most important metric is eccentricity. There's so little vertical scale between 0 and 1 on the Statistics panel that it's hard to see what's going on.
Thanks again,
Scott
Please Log in or Create an account to join the conversation.