INDI Library v2.0.7 is Released (01 Apr 2024)
Bi-monthly release with minor bug fixes and improvements
Optimal Sub-Exposure Calculator help
Replied by vera on topic Optimal Sub-Exposure Calculator help
after some tests the issue comes from language selected
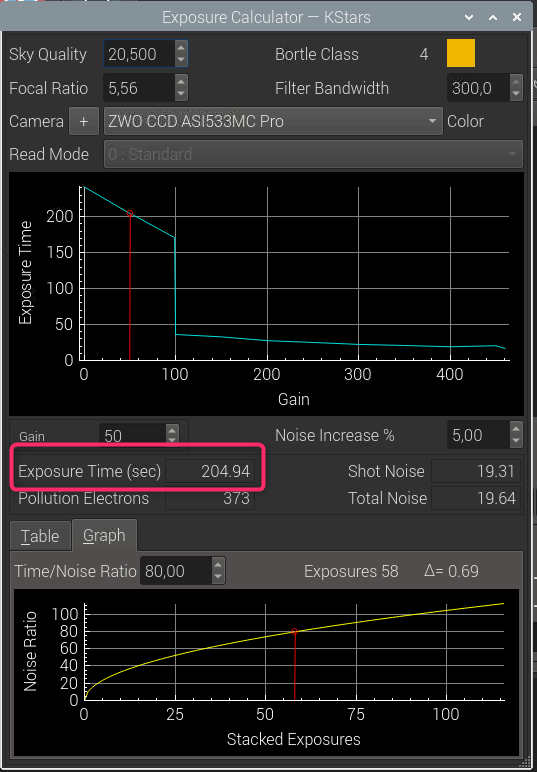
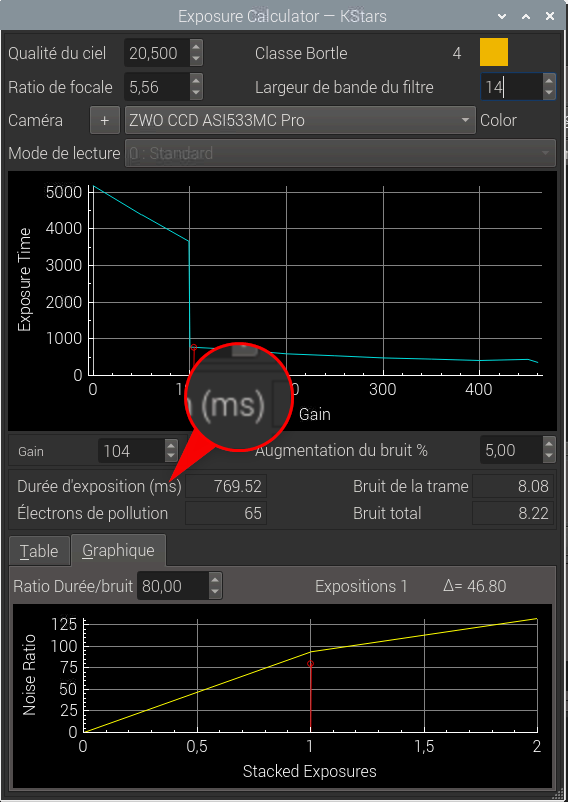
you're right in English we have Sec but in French i have ms, see my screenshots.
but values are the same.
So is it 769 Sec or 769 ms ???
Maybe is just an translation issue ?
Please Log in or Create an account to join the conversation.
- Joseph McGee
-

- Offline
- Senior Member
-

- Posts: 42
- Thank you received: 11
Replied by Joseph McGee on topic Optimal Sub-Exposure Calculator help
I agree, there appears to be an error in the French translation file. I will try to escalate this for a correction.
Please Log in or Create an account to join the conversation.
- Richard Francis
-

- Offline
- Premium Member
-

- Posts: 147
- Thank you received: 16
Replied by Richard Francis on topic Optimal Sub-Exposure Calculator help
In the dialog there is a conversion from the entered SQM value to Bortle scale. What is the conversion used?
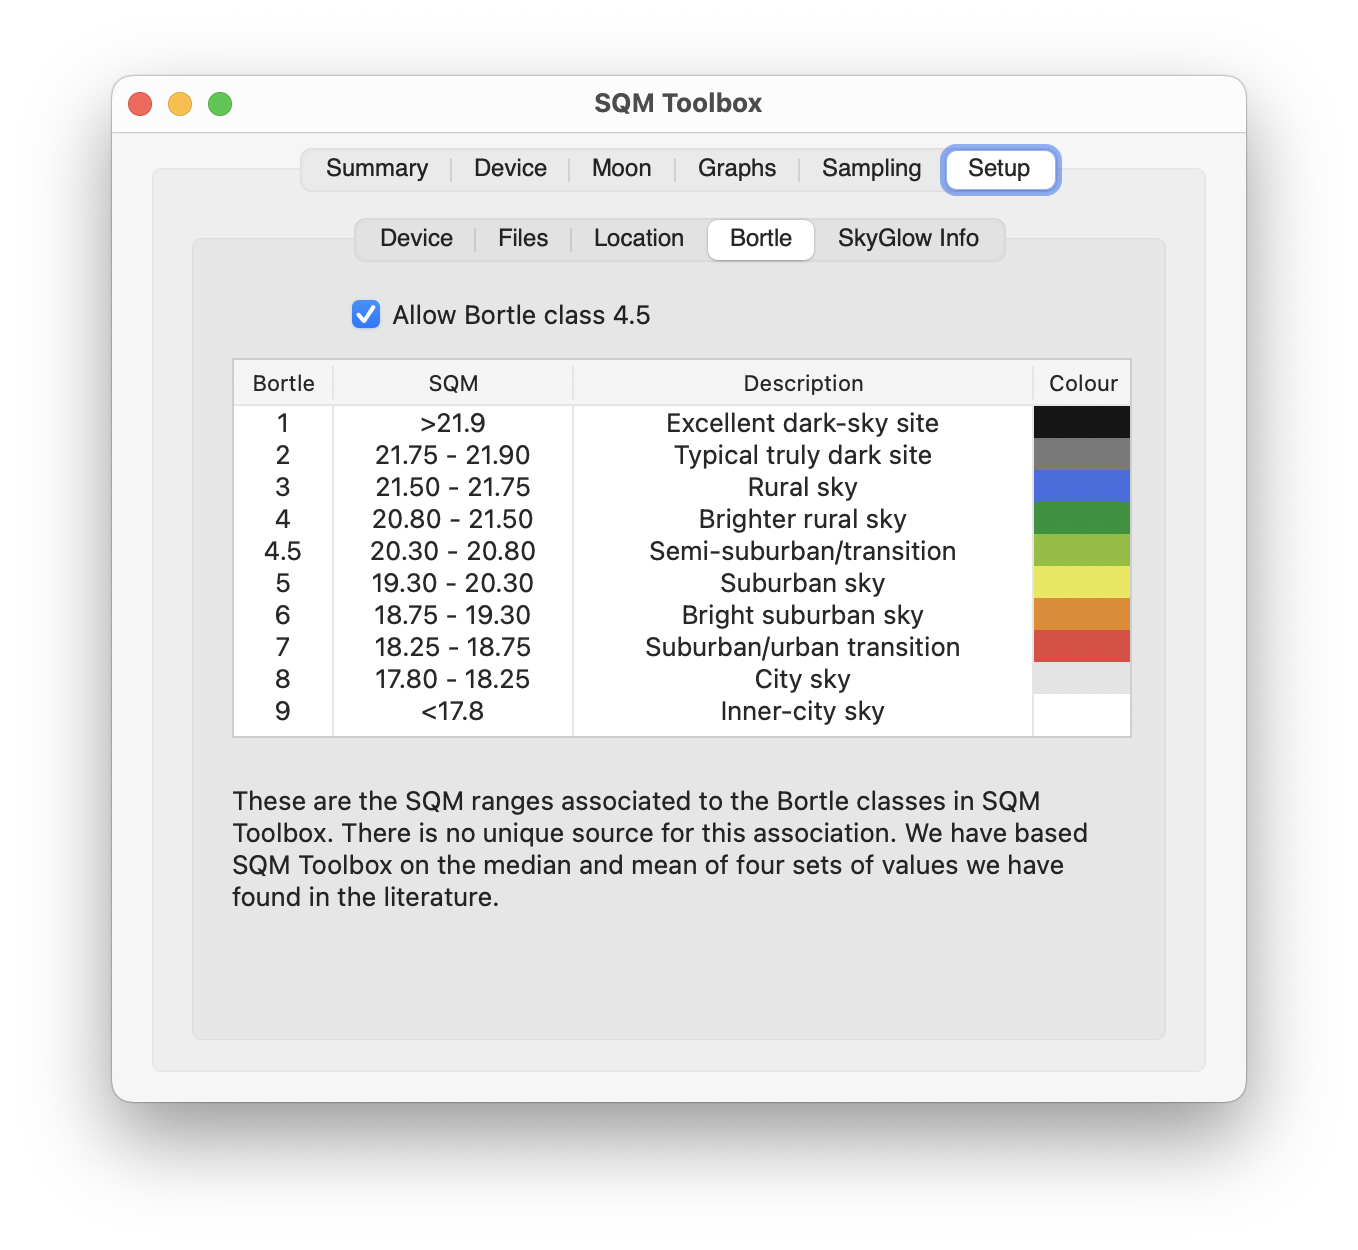
I ask because I have an App in development to read SQM devices and it includes a conversion SQM->Bortle class. But my background research has shown there is no agreed conversion. I found at least 4 different ones (and some introduce a class 4.5 as well). I opted for a combination of median and mean amongst the 4 scales, as far as seemed practical. My table looks like this:
Sorry for the off-topic!
Richard
Attachments:
Please Log in or Create an account to join the conversation.
- Frederick Ruegsegger
-
- Offline
- Elite Member
-

- Posts: 211
- Thank you received: 30
Replied by Frederick Ruegsegger on topic Optimal Sub-Exposure Calculator help
Best,
Fred
Please Log in or Create an account to join the conversation.
- Joseph McGee
-
- Offline
- Senior Member
-
- Posts: 42
- Thank you received: 11
Replied by Joseph McGee on topic Optimal Sub-Exposure Calculator help
I struggled with trying to find a "balance" among the few sources I could find for translation of of SQM to Bortle. I guess the main issue is that Bortle scale in inherently subjective. (I'm sort of hoping that SQM being more subjective will supplant the Bortle scale eventually. )
I chose to avoid breaking out the conversion of values using scales that had bortle values with half steps since these were not included included in original document I found by John Bortle. So my approach for the display of the value just employed the following set of conditions similar to your table, (I'd be happy to adjust this if we could find a consensus).
QString skyQualityToBortleClassNumber(double anSQMValue)
{
QString aBortleClassNumber;
if(anSQMValue < 18.38)
{
aBortleClassNumber = "8 to 9";
}
else if(anSQMValue < 18.94)
{
aBortleClassNumber = "7";
}
else if(anSQMValue < 19.50)
{
aBortleClassNumber = "6";
}
else if(anSQMValue < 20.49)
{
aBortleClassNumber = "5";
}
else if(anSQMValue < 21.69)
{
aBortleClassNumber = "4";
}
else if(anSQMValue < 21.89)
{
aBortleClassNumber = "3";
}
else if(anSQMValue < 21.99)
{
aBortleClassNumber = "2";
}
else aBortleClassNumber = "1";
return(aBortleClassNumber);
}
But the function I developed in trying to get a smooth transition while mapping SQM to a bortle class color was a bit more intensive. It took quite a bit of curve fitting is a few ranges:
// calculate a Bortle style color based on SQM
QColor makeASkyQualityColor(double anSQMValue)
{
QColor aSkyBrightnessColor;
int aHueDegree, aSaturation, aValue;
if(anSQMValue < 18.32) // White Zone
{
aHueDegree = 40;
aSaturation = 0; // Saturation must move from
aValue = 254; // Value must move from 254 to 240
}
else if(anSQMValue < 18.44) // From White Zone at 18.32 transitioning to Red Zone at 18.44
{
aHueDegree = 0; // Hue is Red,
// Saturation must transition from 0 to 255 as SQM moves from 18.32 to 18.44
aSaturation = (int)(255 * ((anSQMValue - (double)18.32) / (18.44 - 18.32)));
aValue = 254;
}
else if(anSQMValue < 21.82 )
{
// In the color range transitions hue of Bortle can be approximated with a polynomial
aHueDegree = 17.351411032 * pow(anSQMValue, 4)
- 1384.0773705 * pow(anSQMValue, 3)
+ 41383.66777 * pow(anSQMValue, 2)
- 549664.28976 * anSQMValue
+ 2736244.0733;
if(aHueDegree < 0) aHueDegree = 0;
aSaturation = 255;
aValue = 240;
}
else if(anSQMValue < 21.92) // Transition from Blue to Dark Gray between 21.82 and 21.92
{
aHueDegree = 240;
// Saturation must transition from 255 to 0
aSaturation = (int) ((2550 * (21.92 - anSQMValue)));
// Value must transition from 240 to 100
aValue = (int)(100 + (1400 * (21.92 - anSQMValue)));
}
else if(anSQMValue < 21.99) // Dark gray zone
{
aHueDegree = 240;
aSaturation = 0;
aValue = 100;
}
else // Black zone should only be 21.99 and up
{
aHueDegree = 240;
aSaturation = 0;
aValue = 0;
}
// qCInfo(KSTARS_EKOS_CAPTURE) << "Sky Quality Color Hue: " << aHueDegree;
// qCInfo(KSTARS_EKOS_CAPTURE) << "Sky Quality Color Saturation: " << aSaturation;
// qCInfo(KSTARS_EKOS_CAPTURE) << "Sky Quality Color Value: " << aValue;
aSkyBrightnessColor.setHsv(aHueDegree, aSaturation, aValue);
return(aSkyBrightnessColor);
}
Please Log in or Create an account to join the conversation.
- Joseph McGee
-
- Offline
- Senior Member
-
- Posts: 42
- Thank you received: 11
Replied by Joseph McGee on topic Optimal Sub-Exposure Calculator help
I will take a look at the data as soon as I can, but I'll be travelling for about a week and may not have a chance to run the process until I return home..
Please Log in or Create an account to join the conversation.
- Ronald Scotti
-
- Offline
- Elite Member
-
- Posts: 398
- Thank you received: 17
Replied by Ronald Scotti on topic Optimal Sub-Exposure Calculator help
Might there be a more empirical way to establish a good sub-exposure time. (Many suggest just pick 20-30 seconds and be done with it for the usual situations). But I am thinking along a different approach. In the current Siril release, it uses a connection to "StarNet" to remove stars from an image. Could you take a series of short exposures (1,5,10,20 seconds - so most guided results are reasonable), subtract the stars, calculate the background noise level (subtracting the other sources of noise in the specific camera) and plot a graph of exposure time vs noise (there are probably many ways to do this). Would this information help to ground your calculations with some actual data (could the two approaches be made to agree thru an adjustable parameter) so that you would not have to rely on what you think the SQM value is for the current session?
I know in the past I have used a method of taking broad sky images with digital camera pointing straight up and measuring the background noise from the dark areas in images. I think this was for coming up with sky brightness values to give an estimate of the Bortle value of your site. But I don't remember the specifics, anymore.
Anyway just a suggestion and a question of whether this would be practical and useful?
Please Log in or Create an account to join the conversation.
- Richard Francis
-
- Offline
- Premium Member
-
- Posts: 147
- Thank you received: 16
Replied by Richard Francis on topic Optimal Sub-Exposure Calculator help
returning to the Bortle scale, I finally had the time to look at your reply in more detail. I shared your struggle in trying to find a definitive conversion. The scale you use is the one quoted by Bruce McEvoy. I also found different versions by Henk Spoelstra (who was the only one to introduce Bortle 4.5), Miguel Martinez-Ledesma et al, and a version of the McEvoy scale extended to Bortle 8 by Attila Danko. There was some difference between these scales, so I took both the mean and median amongst them and assigned a value rounded to the nearest 0.05, based on those. It's not very scientific but, as you said, it's subjective anyway.
The 4.5 is a bit odd, being only introduced by Henk Spoelstra -- but it's his nomogram which is the basis for scale in the Wikipedia page on the subject, and which was featured in the 2009 Dark Skies Awareness project. The Bruce McEvoy scale is the most widely reused, as far as I could see.
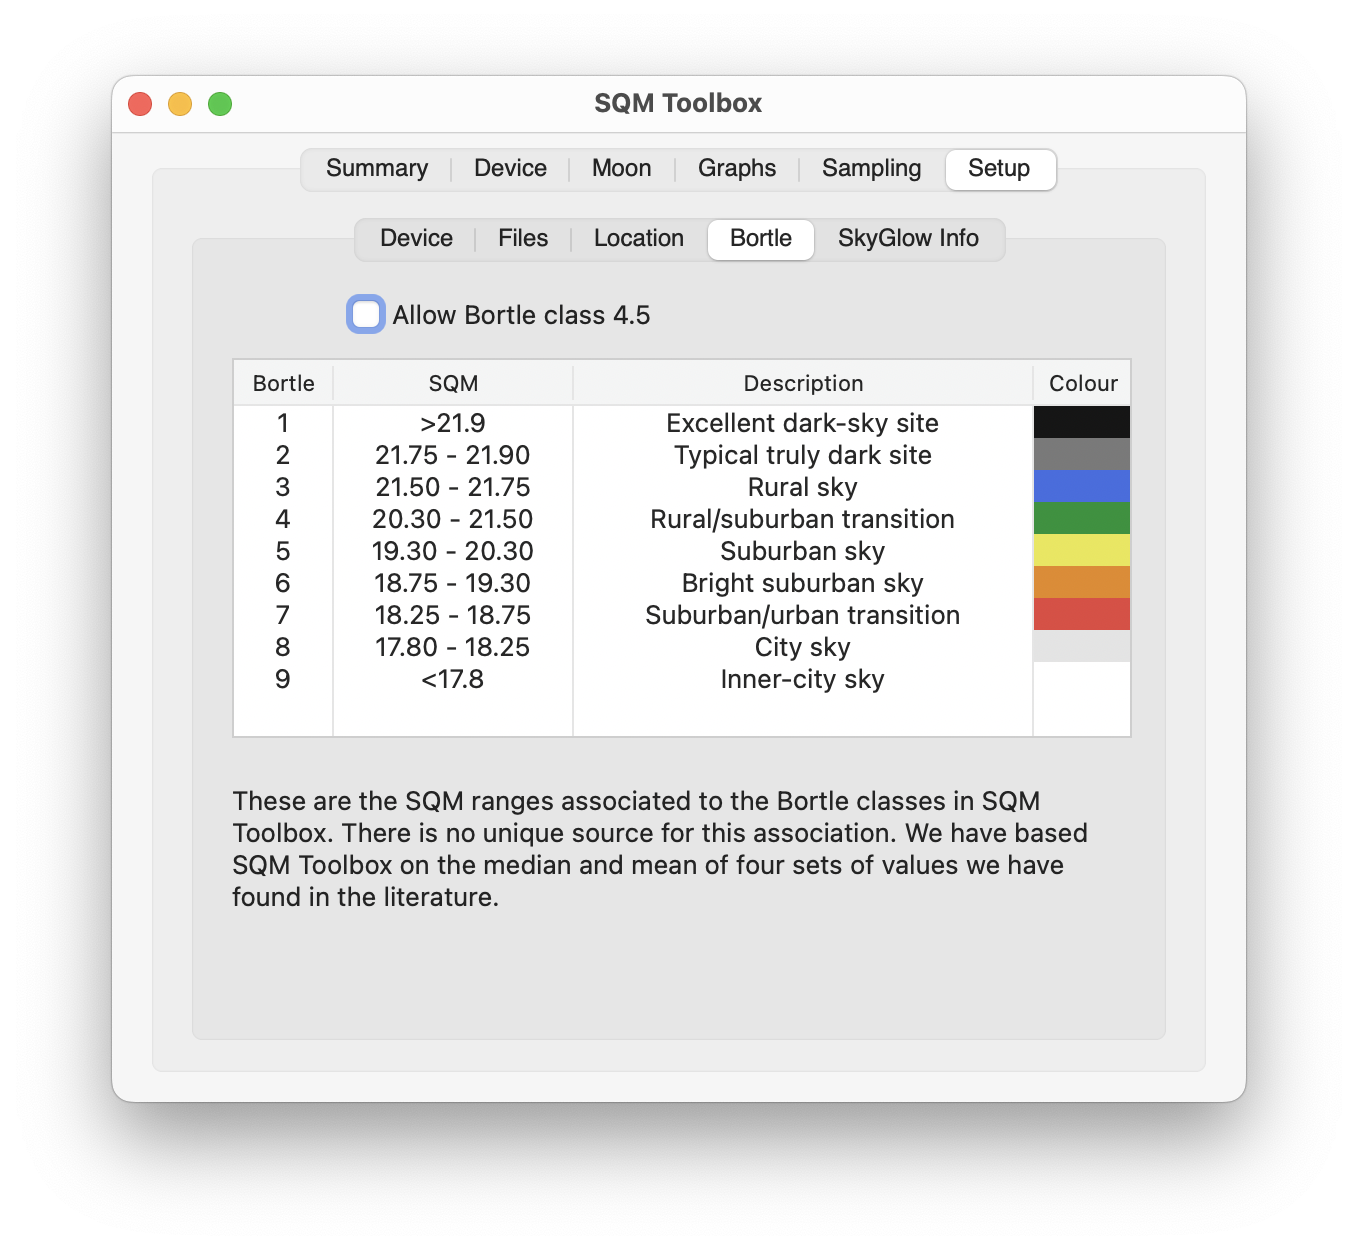
In my app, I leave the choice of 4.5 up to the user, which is why I sent the two versions.
But the reason I asked the question was to see if you had a different version.
Thanks,
Richard
Please Log in or Create an account to join the conversation.
- Joseph McGee
-
- Offline
- Senior Member
-
- Posts: 42
- Thank you received: 11
Replied by Joseph McGee on topic Optimal Sub-Exposure Calculator help
Sorry for the slow response, I was travelling on a family matter.
As for measuring Sky Quality via a process with imaging equipment; that is something I'm interested in developing. I had read about the process some time ago, but what I read required human interaction in manual section of a background area of the image. (I instead chose to purchase a Unihedron meter during the development of the exposure calculator.) It would be an interesting challenge to develop a more "hands-off" process for determining a value for sky quality with imaging equipment, but at the moment I am working on a tool for mapping camera sensor read noise. I also found that on-line tools like light pollution map are fairly accurate, but they give an optimistic value (no moon, and no clouds reflecting artificial light). So using on-line tools without adjusting for these factors would tend to produce longer exposures than would be recommended with an accurate value for sky quality.
As for simply choosing a consistent exposure time (like 20 to 30 seconds); when I first proposed developing the calculator for KStars there was strong argument against it. The suggestion was that we should consistently use exposures of 3 to 4 minutes. But my experience suggests that a great deal depends upon both the sky quality and components in the optical train. Before I found the presentation by Dr Glover, I spent several weeks with a trial and error approach to find acceptable exposure times for my equipment at two different sites (my backyard with about SQ 19.4 and a nearby mount range SQ 21.5). After I found his presentation I created a spreadsheet for my gear at these sites. I was astonished by how closely the calculations matched the values I found from my many weeks of effort.
Please Log in or Create an account to join the conversation.
- Ronald Scotti
-
- Offline
- Elite Member
-
- Posts: 398
- Thank you received: 17
Replied by Ronald Scotti on topic Optimal Sub-Exposure Calculator help
I have to admit that I am an impatient Astrophotographer. If the night is clear and the equipment is all working well, I will start with short exposures of 10 seconds (depending on the target), then 20, 30 60 120 and even 180 seconds. Usually my guiding starts to break down somewhere between 1 to 3 minutes, so I am limited there by my equipment. What I find is that for long exposures I can begin to 'see' the object (Nebula or galaxy) and so I start to take more of those exposures. But what I sometimes discover later is that the sky noise was to high or the stars are blown out and so I have a difficult time processing the data as I have to blend multiple exposures.
So optimizing the exposure time is important and knowing how many subs you will need to take to bring the object out the noise clearly. But, I am not the inclined to spend many multiple hours on a target. Usually what I can get in one evening is going to have to be good enough. I think more of us fall into that category than those who have permeant observatories and can spend multiple nights on a target.
I am trying to do the best I can in a limited time and I am not sure that fits very well with Dr. Glovers approach. But I believe his math. The capability of image processing software is in a constant state of flux. I have only just used the StarNet Star subtraction capability in Siril, so that I can stretch a starless image.
I guess what I am saying is that I understand it is complicated by all these factors. I am looking for something that guides me at the moment, with the object in view, that says this may be a way to proceed. A dogmatic approach that says that 300 ten second images on target will get you an image with a SNR that exceeds a certain value just does not seem to help. First, that is 5 hours of image collection and second if I cannot get those 5 hours have I just wasted my time.
I am not trying to take pictures for APOD, I am just trying to enjoy the hobby with results that I am proud of and amazed that I can produce an image of something that far away.
Sorry, for the digression. I appreciate what your exposure calculator is providing us with and I will have to spend more time with it.
I had a good night and collected a bunch of data. This is the result of simple processing of a half hour of 60 second exposures (I have more images at longer and shorter exposures but I had the most at this exposure)
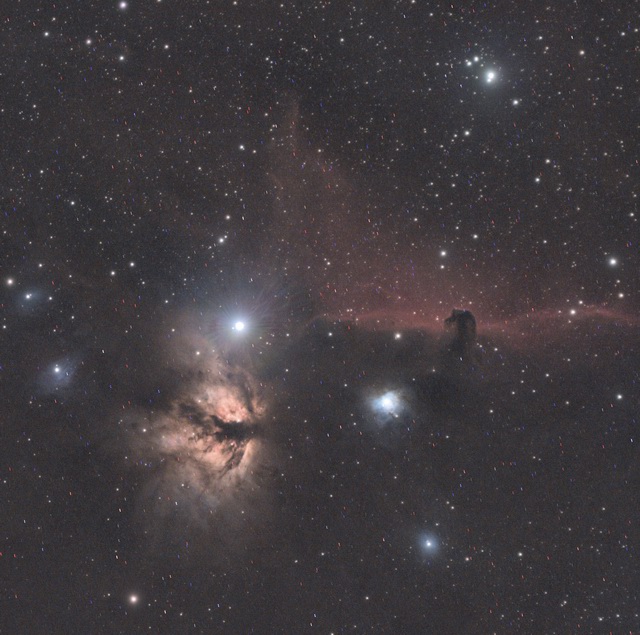
I will spend some more time with the data to see if I can clean it up better. But I am struggling to decide where the most effort should be applied.
Thanks again
Attachments:
Please Log in or Create an account to join the conversation.
- Ronald Scotti
-
- Offline
- Elite Member
-
- Posts: 398
- Thank you received: 17
Replied by Ronald Scotti on topic Optimal Sub-Exposure Calculator help
When I look up my location on a Dark Skies Map it says that I am 21.77 sqm, looking vertical with no moon, etc. So I am fortunate that I am in a Bortle 3 location. I use your calculator for my ASI 533 camera and it gives me very reasonable numbers for exposure times (Its dark so I can go long) and very achievable exposure counts, only tens at long exposure. But my equipment does not guide well enough for a 300 second exposure. So how should I use your numbers? Should I calculate the total exposure time (exposure x number) and use that as a goal with my shorter exposures? I do not see anyway to put my own exposure time in and have it give me how many images I should capture. In my actual experience I can see a definite difference in background level between 120 sec and 180 sec exposure (this being brighter). So I am inclined to stay with the shorter exposure and just take more images.
Another, simple, question. What filter bandwidth should I use for an OCS camera? Is it the full bandwidth covered by all RGB or that of each individual color (that is what I would assume).
I need to watch your video again.
thanks,
Please Log in or Create an account to join the conversation.
- Joseph McGee
-
- Offline
- Senior Member
-
- Posts: 42
- Thank you received: 11
Replied by Joseph McGee on topic Optimal Sub-Exposure Calculator help
I agree that the calculator can produce exposure times that are beyond reasonable given limitations in equipment and conditions. With extreme inputs, in very dark sky , a fast optic, and narrow band filters the calculation might be so long that it would only be viable within the arctic circle in Winter,
") .
.To reduce exposure time, my first recommendation is to consider a reduction in gain on the camera. Raising the camera gain, will typically reduce the read-noise, and result in a lower exposure time, (but usually at the cost of losing some dynamic range). However, some cameras have an electronic switch that changes the read mode. In these cameras, you will notice a pronounced step in the exposure time graph. At the bottom of this step, read-noise is low, but dynamic-range would typically jump back up, (because dynamic range is effected by read-noise). So if you have camera that shows a step in the exposure time graph, you might want to push the gain up just slightly to the right of that step.
There is another way to force the calculation to go outside the range recommended by Dr Glover, His calculation uses an input called "Noise Increase %". This input controls the factor that is used to compute the balance between the noise from light pollution and the read noise in the camera (this factor is sometimes referred to as the "swamp factor"). Dr Glover recommended using 5% (or lowering to 2% if the exposure time is very short). But I chose to leave this input relatively unlimited so that users could get results for exposure times that meet their needs. You can think of the "noise increase %" as governing the relative amount of read-noise, so an increase in this input will lower the exposure time, (which results in a relative increase in read-noise in the image). Read noise is constant, so a shorter image will have higher amount of read-noise relative to noise from light pollution). So to reduce an exposure time you just need to raise the input value of the "noise increase %".
As you adjust the noise increase upward the exposure time will drop, but you will also notice that sub-exposure count will climb disproportionately, this is because shorter exposures are relatively more noisy, and so more stacking is required to achieve a similar final result.
As for the filter input for an OSC. With no filter, you would use a value of 300 nm. If you end up using a filter, then some analysis of the filter is required. For example, with my OSC on nebulae I use an Optolong L-enHance two-band filter, for this filter I input a value of 34 nm, (this value is arrived at by adding the widths of the two bands passed by this filter).
Please Log in or Create an account to join the conversation.