INDI Library v2.0.7 is Released (01 Apr 2024)
Bi-monthly release with minor bug fixes and improvements
Optimal Sub-Exposure Calculator help
- Joseph McGee
-

- Offline
- Senior Member
-

- Posts: 42
- Thank you received: 11
Replied by Joseph McGee on topic Optimal Sub-Exposure Calculator help
Sorry for the delay, I had a family matter that required my attention and took me on a long trip over the past week. I had also had some enhancements to implement in my tool, and found a defect in my calculations to resolve, (it turned out to have a negligible effect on the result). The attached pdf shows a re-run of your data.
I've created exposure calculator files for your cameras and copied them to your folder on the Google drive. So you should be able to copy these to a KStars cameradata folder.
But for the Moravian C5A I've created two versions. Let me explain; the camera data files support 3 "modes" for sensors:
"FIXED" handles true CCD cameras, so there is essentially only one read-noise value in the file.
"ISO_DISCRETE" was intended to handle DSLR cameras where the selection of gain/iso is from a list of discreet values.
"NORMAL" handles cameras that have gain values that variable over a broad range: the camera data files include a table of values, but the exposure calculator will interpolate between these gain values to produce a read-noise value.
When I first built the calculator, I had created a file for a Moravian C3 in a "Normal" mode. But from what you have described in a prior communication, I now suspect that was not correct. From what you described, its seems that that the Moravian cameras are more like DSLRs in that they only allow a discrete value for gain selection.
So for your Moravian C5A, you will find a version with a file name that ends in "-D" (for discrete e.i. "DSLR" mode), and version that ends in "I" (for interpolated e.i. "Normal" mode). When running the calculator with the "-D" camera data you will find a dropdown that lists just the 0, and 2750 gain values, (But the label on the calculator will show "ISO"). when running the "-I" file the calculator will allow you to select values within that range of 0 to 2750, (but I as I said I think this is incorrect),
Let me know if my understanding on the Morivain cameras is correct.
Thanks
Please Log in or Create an account to join the conversation.
- Ronald Scotti
-
- Offline
- Elite Member
-

- Posts: 396
- Thank you received: 17
Replied by Ronald Scotti on topic Optimal Sub-Exposure Calculator help
Please Log in or Create an account to join the conversation.
Replied by Vladimir on topic Optimal Sub-Exposure Calculator help
Sorry for the long scilence!
I retaken data for gain 50 of ASI294MC Pro and close around gains.
Also, I'v recieved ZWO ASI294MM Pro. I gotten and uploaded data for this camera too. I made frames with 2x2 binning as main mode of shooting. If need I'll make bin 1x1.
Please Log in or Create an account to join the conversation.
- Joseph McGee
-
- Offline
- Senior Member
-
- Posts: 42
- Thank you received: 11
Replied by Joseph McGee on topic Optimal Sub-Exposure Calculator help
Please Log in or Create an account to join the conversation.
- Joseph McGee
-
- Offline
- Senior Member
-
- Posts: 42
- Thank you received: 11
Replied by Joseph McGee on topic Optimal Sub-Exposure Calculator help
Sorry for my slow progress and responses on the camera sensor analyzer tool. I've been trying to understand a problem in my process that impacts the results for Color sensors. (I'm fairly confident with the results on monochrome sensors).
When processing color camera data, it seems that white balance settings that are used when capturing the bias and flat images can impact the outcome of the analysis. For example, while testing my own ASI-178MC, I first used the manual white balance settings that I had established long ago, which produce mean ADU values for all color channels that are fairly even (as close as possible), WB Red 33, and WB Blue 92. The flat images appeared fairly neutral gray, (just slightly green). From this test, the resulting read-noise values from my tool were within 1% of those shown in ZWO documentation. But in a second test I set both WB Red and WB Blue to 80; the flat images appeared very red. From this test, the resulting read-noise values from my tool were generally lower (by around 3%), and the overall results over the range of gain values were less consistent (the read-noise curve had noticeable "bumps" that were not apparent in the test with white balance values that produced neutral looking flats).
My tool calculates mean values for each channel of the input data, so I should be able recognize if the input flat images are not "neutral". But I'm not certain whether I would be able to programatically compensate for this. If anyone has ideas on this, please let me know.
I had planned to develop a "front-end" process for my tool to perform the capture of the input files. In that process I might be able to control the white balance values to force the images to be neutral, but this development effort will likely take quite some time.
Thanks
Please Log in or Create an account to join the conversation.
- Joseph McGee
-
- Offline
- Senior Member
-
- Posts: 42
- Thank you received: 11
Replied by Joseph McGee on topic Optimal Sub-Exposure Calculator help
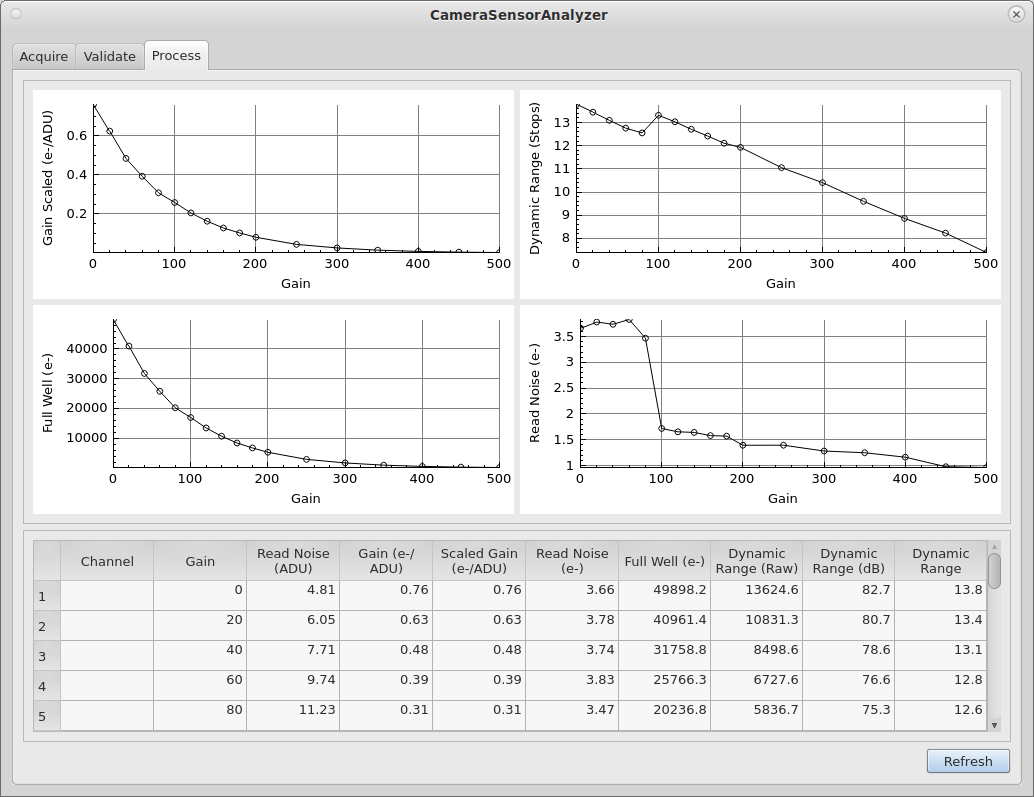
I re-processed your ASI-294 MC data including the additional bias and flats new files you provided. I've uploaded into the ASI-294MC folder on the google share, some png files of the graphs, and also an xml file that will work for the exposure calculator. Be aware that my original code from a few weeks ago had a bug that caused some minor calculation issues, that was corrected before I re-ran this data.
But I'm seeing something in the data from your 294 MC that is interesting. If you look at the read-noise values for the "low" gains, before the camera switches modes, the values for each color channel are pretty erratic. But at gains above the point of the mode switch (around gain 120), the values of the channels is nearly identical. I'm wondering whether this is just a "normal" behavior for the read mode that is used at the lower gain settings.
I will run your 294 MM data next.
Attachments:
Please Log in or Create an account to join the conversation.
- Joseph McGee
-
- Offline
- Senior Member
-
- Posts: 42
- Thank you received: 11
Replied by Joseph McGee on topic Optimal Sub-Exposure Calculator help
Please Log in or Create an account to join the conversation.
Replied by Vladimir on topic Optimal Sub-Exposure Calculator help
I plan to compare calculated results based on Your xml-file and xml-file that I made on data from spreadsheet presented in this message
Please Log in or Create an account to join the conversation.

Replied by Bastian on topic Optimal Sub-Exposure Calculator help
(On Mac, copy to ~/Library/Application Support/kstars/cameradata)
Attachments:
Please Log in or Create an account to join the conversation.
- Joseph McGee
-
- Offline
- Senior Member
-
- Posts: 42
- Thank you received: 11
Replied by Joseph McGee on topic Optimal Sub-Exposure Calculator help
Sorry that I've not responded sooner regarding the camera files you provided. I learned quite a bit while processing files, and needed to add some new features to my sensor analysis tool. My tool still has some difficulty in processing color image data, (white balance settings on the camera seem to produce some aberrations in my calculations). But I've now run the data for your ASI-6200MM through a new version of my tool. A screen shot of the result is attached. (But I would not rely upon this as being an accurate result yet).
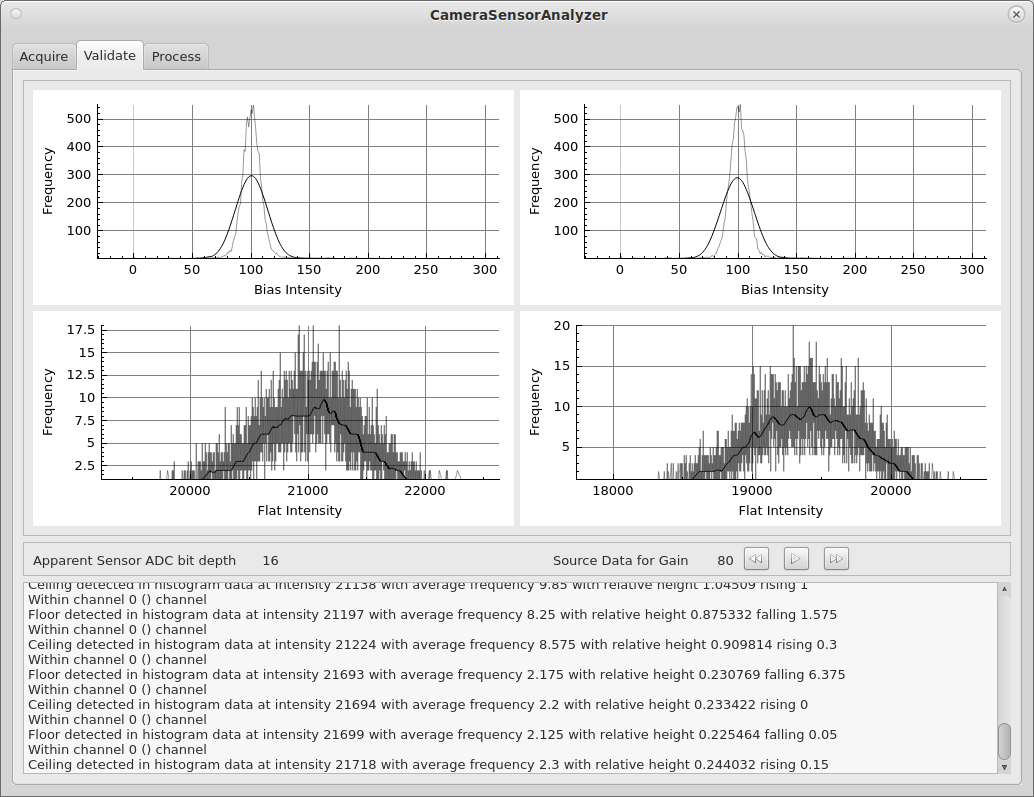
One of the new features in my tool is a process that attempts to validate input files. It will produce and display histogram data of the four input files for given gain; and it will run a few analytic tests on the data. One test is intended to detect pattern noise in the images. In a few of the flat images that you provided, my tool recognized pattern noise and generated a warning. A screen shot for that is also attached.
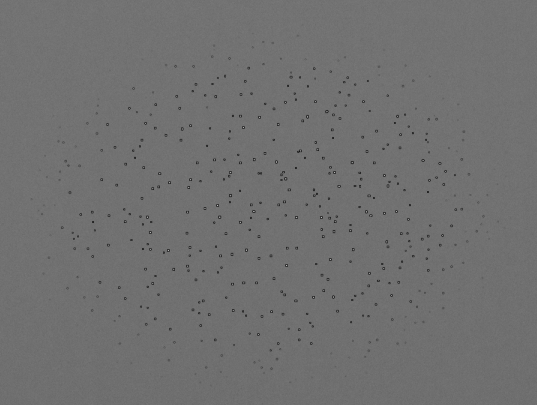
So I reviewed the flat files in KStars fitsviewer and see that in the flat files at gain 60, 80 and 100; the center of the images have some odd speckles. In making is assessment of a sensor, my tool only analyzes a 100 x 100 pixel region at the center of the images. So these odd speckles at the center of the images may have a significant impact in the results from my tool.
Please Log in or Create an account to join the conversation.
- Frederick Ruegsegger
-
- Offline
- Elite Member
-
- Posts: 211
- Thank you received: 30
Replied by Frederick Ruegsegger on topic Optimal Sub-Exposure Calculator help
Thanks for the feedback. First, I'll say that the graphs are surprisingly (at least to me) close to the published specs from ZWO. Second, let me go back and see if I can get you some clean flats for those gain settings. I took a look at the frames and I can't explain why those 3 gain settings might have exhibited those artifacts. All the flat frames were taken in sequence in order of ascending gain, one pair after the other.
Hopefully get you clean frames in the next day or two.
Fred
Please Log in or Create an account to join the conversation.
- Joseph McGee
-
- Offline
- Senior Member
-
- Posts: 42
- Thank you received: 11
Replied by Joseph McGee on topic Optimal Sub-Exposure Calculator help
I just created an ascii tab delimited data file for the current results on your ASI-6200MM. The file has values to 4 decimal places. It's in your home folder on the google share. File Name is Fred_ASI-6200MM_2024-03-14.dat
After you provide the new flat images, I'll re-run and make another file to compare, the results.
Please Log in or Create an account to join the conversation.