INDI Library v2.0.7 is Released (01 Apr 2024)
Bi-monthly release with minor bug fixes and improvements
Optimal Sub-Exposure Calculator help
- Joseph McGee
-

- Offline
- Senior Member
-

- Posts: 42
- Thank you received: 11
Replied by Joseph McGee on topic Optimal Sub-Exposure Calculator help
I re-processed your ASI-294 MC data including the additional bias and flats new files you provided. I've uploaded into the ASI-294MC folder on the google share, some png files of the graphs, and also an xml file that will work for the exposure calculator. Be aware that my original code from a few weeks ago had a bug that caused some minor calculation issues, that was corrected before I re-ran this data.
But I'm seeing something in the data from your 294 MC that is interesting. If you look at the read-noise values for the "low" gains, before the camera switches modes, the values for each color channel are pretty erratic. But at gains above the point of the mode switch (around gain 120), the values of the channels is nearly identical. I'm wondering whether this is just a "normal" behavior for the read mode that is used at the lower gain settings.
I will run your 294 MM data next.
Attachments:
Please Log in or Create an account to join the conversation.
- Joseph McGee
-
- Offline
- Senior Member
-
- Posts: 42
- Thank you received: 11
Replied by Joseph McGee on topic Optimal Sub-Exposure Calculator help
Please Log in or Create an account to join the conversation.
Replied by Vladimir on topic Optimal Sub-Exposure Calculator help
I plan to compare calculated results based on Your xml-file and xml-file that I made on data from spreadsheet presented in this message
Please Log in or Create an account to join the conversation.

Replied by Bastian on topic Optimal Sub-Exposure Calculator help
(On Mac, copy to ~/Library/Application Support/kstars/cameradata)
Attachments:
Please Log in or Create an account to join the conversation.
- Joseph McGee
-
- Offline
- Senior Member
-
- Posts: 42
- Thank you received: 11
Replied by Joseph McGee on topic Optimal Sub-Exposure Calculator help
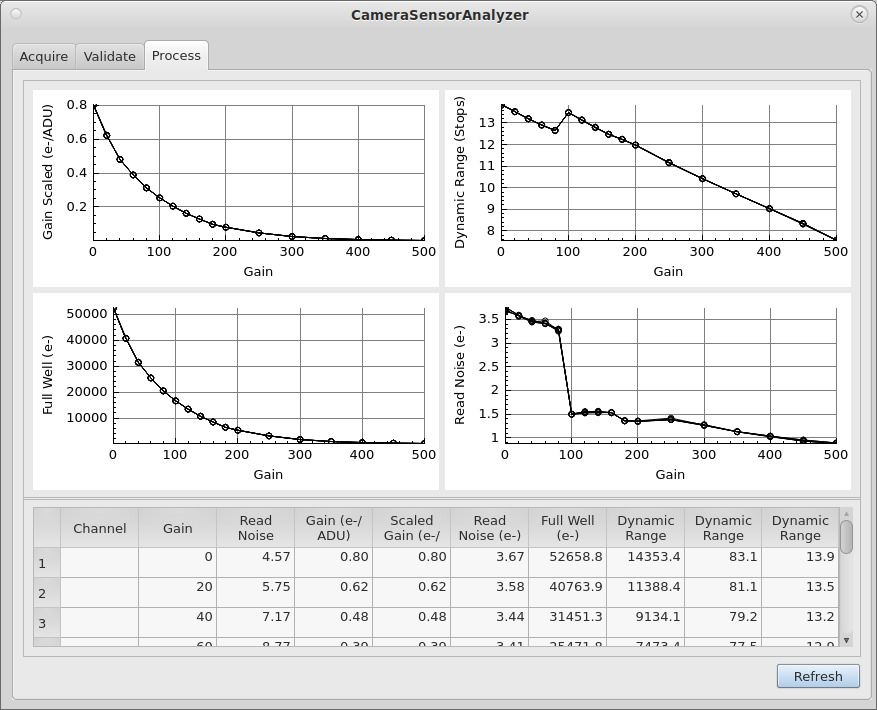
Sorry that I've not responded sooner regarding the camera files you provided. I learned quite a bit while processing files, and needed to add some new features to my sensor analysis tool. My tool still has some difficulty in processing color image data, (white balance settings on the camera seem to produce some aberrations in my calculations). But I've now run the data for your ASI-6200MM through a new version of my tool. A screen shot of the result is attached. (But I would not rely upon this as being an accurate result yet).
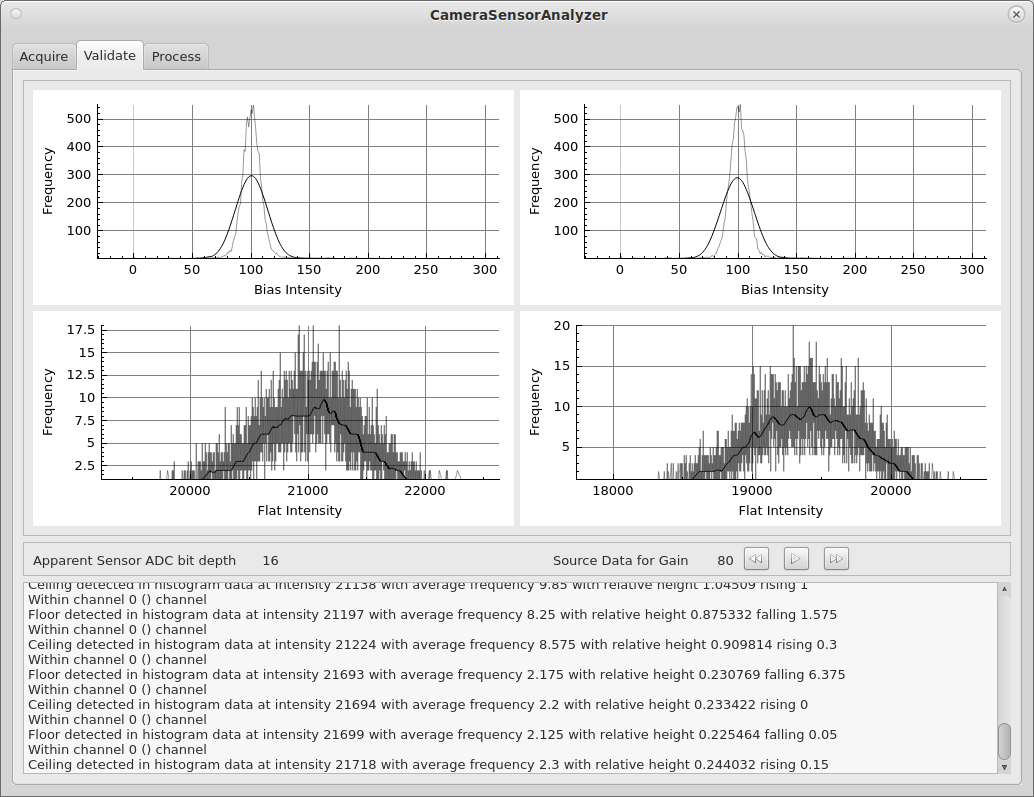
One of the new features in my tool is a process that attempts to validate input files. It will produce and display histogram data of the four input files for given gain; and it will run a few analytic tests on the data. One test is intended to detect pattern noise in the images. In a few of the flat images that you provided, my tool recognized pattern noise and generated a warning. A screen shot for that is also attached.
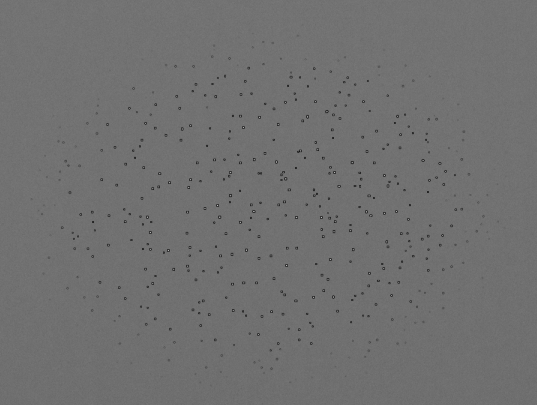
So I reviewed the flat files in KStars fitsviewer and see that in the flat files at gain 60, 80 and 100; the center of the images have some odd speckles. In making is assessment of a sensor, my tool only analyzes a 100 x 100 pixel region at the center of the images. So these odd speckles at the center of the images may have a significant impact in the results from my tool.
Please Log in or Create an account to join the conversation.
- Frederick Ruegsegger
-
- Offline
- Elite Member
-

- Posts: 211
- Thank you received: 30
Replied by Frederick Ruegsegger on topic Optimal Sub-Exposure Calculator help
Thanks for the feedback. First, I'll say that the graphs are surprisingly (at least to me) close to the published specs from ZWO. Second, let me go back and see if I can get you some clean flats for those gain settings. I took a look at the frames and I can't explain why those 3 gain settings might have exhibited those artifacts. All the flat frames were taken in sequence in order of ascending gain, one pair after the other.
Hopefully get you clean frames in the next day or two.
Fred
Please Log in or Create an account to join the conversation.
- Joseph McGee
-
- Offline
- Senior Member
-
- Posts: 42
- Thank you received: 11
Replied by Joseph McGee on topic Optimal Sub-Exposure Calculator help
I just created an ascii tab delimited data file for the current results on your ASI-6200MM. The file has values to 4 decimal places. It's in your home folder on the google share. File Name is Fred_ASI-6200MM_2024-03-14.dat
After you provide the new flat images, I'll re-run and make another file to compare, the results.
Please Log in or Create an account to join the conversation.
- Joseph McGee
-
- Offline
- Senior Member
-
- Posts: 42
- Thank you received: 11
Replied by Joseph McGee on topic Optimal Sub-Exposure Calculator help
A correction... I had made a temporary change to my code to select data from another region of the image to avoid the area where those speckles are. I forgot to undo that change when I was running tests and when I extracted the results. So I've renamed the dat file on google, and added another version. The new one is data from the center, (which is what we want to use) the other is from the corner at (1,1).
Sorry for my confusion, this project has wiped out a few of my best brain cells.
Please Log in or Create an account to join the conversation.
- Frederick Ruegsegger
-
- Offline
- Elite Member
-
- Posts: 211
- Thank you received: 30
Replied by Frederick Ruegsegger on topic Optimal Sub-Exposure Calculator help
I've posted revised files here: drive.google.com/file/d/14ADHoURhUkqGXb9.../view?usp=share_link. I checked the region in question in the new files and they aren't exhibiting the speckles. The cause of those is a mystery!
Thanks for all your work on this.
Fred
Please Log in or Create an account to join the conversation.
- Joseph McGee
-
- Offline
- Senior Member
-
- Posts: 42
- Thank you received: 11
Replied by Joseph McGee on topic Optimal Sub-Exposure Calculator help
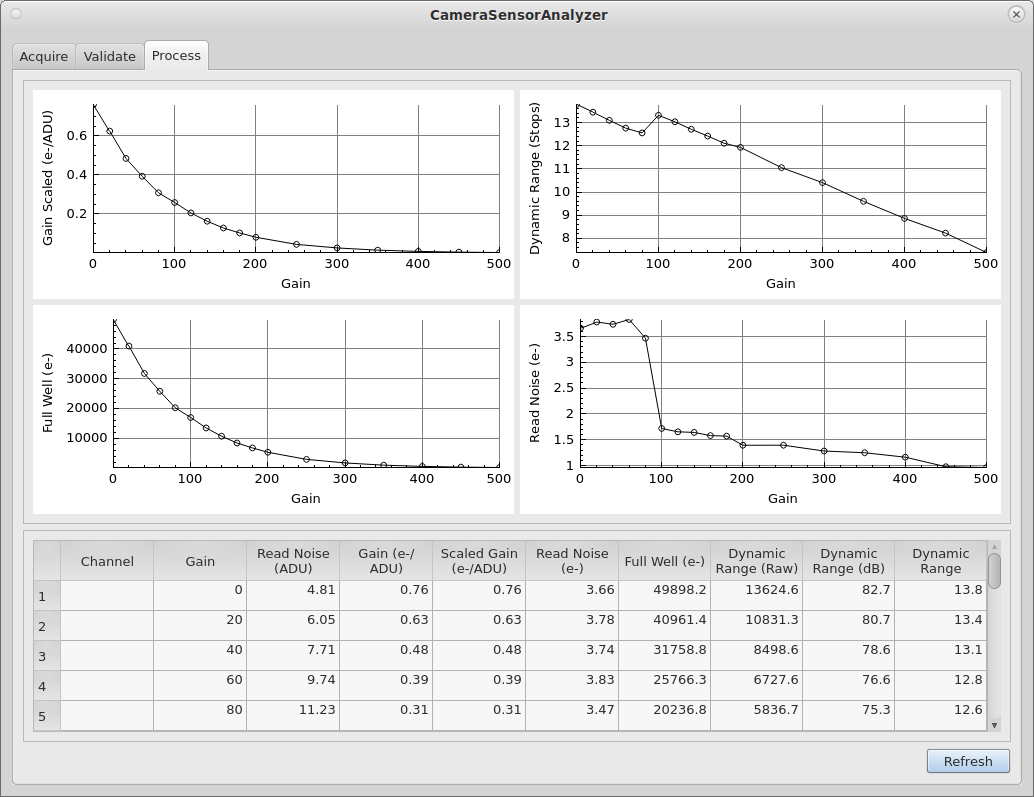
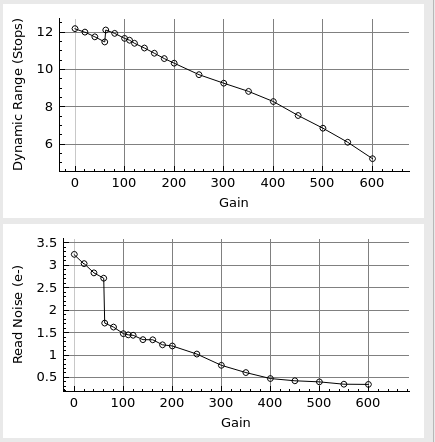
I re-ran the analysis with the revised flat files, it definitely changed the results for gains 60, 80, and 100. Onto the google share folder I've uploaded a new data output file, Fred_ASI-6200MM_Center-Revised-2024-03-16.dat which can be compared with Fred_ASI-6200MM_Center-2024-03-15.dat if you care to see what changed in the results.. A screen shot of the graphs from new analysis is attached here (and a copy is also on the google share).
The only substantial difference between the ZWO data and results from this tool have to do with identifying exactly where the mode switching occurs in this camera (that abrupt drop in read noise). Per ZWO the mode switching occurs at gain 100. From the data we used in my tool I can only say that happens between 80 and 100. If you are curious to know exactly where that switch occurs, we would need to include bias and flats that are slightly below 100.
But, I think my next effort on this project is going to be developing a process that will drive the acquisition of the bias and flats images. In that process I hope to be able to automatically identify where cameras are doing mode switching. I also need to develop some processes to resolve issues with white balance settings on color sensors. So if you have no urgent interest in knowing where that mode switch is occurring, that's fine; hopefully the data acquisition function will be able to find it for you when I get this tool to the point where it can be deployed.
Please Log in or Create an account to join the conversation.
- Frederick Ruegsegger
-
- Offline
- Elite Member
-
- Posts: 211
- Thank you received: 30
Replied by Frederick Ruegsegger on topic Optimal Sub-Exposure Calculator help
Thanks for the work you are doing on this. I usually shoot at gain = 0 so I haven't spent much time sorting out exactly where the mode switching occurs. If it is of use to you, I'd be happy to do some more work with the camera and test intermediate gain levels - just let me know. Heading into a week or more of cloudy weather here.
If you are interested in the data, advice on how to approach the project would be great. For example, would it make sense to start at gain = 100 and just back down by 1 unit for each set of frames? I'm not sure I know how to recognize when I hit the mode switching point so would I just continue to shoot in 1 step increments all the way down to gain = 80?
Best,
Fred
Please Log in or Create an account to join the conversation.
- Joseph McGee
-
- Offline
- Senior Member
-
- Posts: 42
- Thank you received: 11
Replied by Joseph McGee on topic Optimal Sub-Exposure Calculator help
At the moment I've been focused on developing the camera client process that will allow my tool to capture the Bias and Flat images needed for the analysis process.
Fortunately, I own a camera that has a mode switch, (it's my guide camera is an ASI-290MM Mini). So I have what I need for testing a process to detect at which gain a mode switch occurs. But feel free to put more Bias and Flat images onto the google share. I can certainly include them and run them through my process to give provide you with a more precise graph and data for your camera.
In case you are interested, here is what I found while working on the capture process:
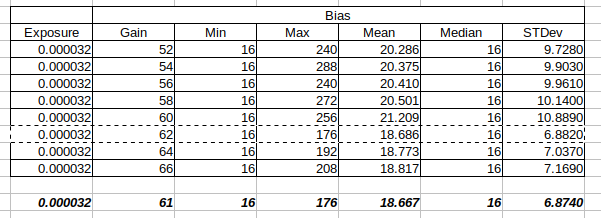
The point at which a mode switch occurs, can actually be seen in changes of statistics in bias images. My ASI-290MM has a switch that occurs at around gain 60. In the initial tests with my tool I only took images at intervals of 20 units of gain. So my 1st graph jumped from 40 to 60, and did not show precisely where the switch occurred. So I ran some tests manually using KStars Indi control panel, using increments of just 2 units of gain, starting well below where the mode switch occurs. I simply noted values for the statistics to see trends. In the attached "ModeSwitching.png" you can see that the values for Mean and Standard Deviation were generally climbing from gain 52 through 60. But at gain 62 there is sudden drop, then the values resume climbing. So I captured another image at 61, and determined that mode switch does, in fact occur between the 60 to 61 gain settings.
So I should be code a detection process that isolate these mode switches.
Please Log in or Create an account to join the conversation.